Ukrainian vs Immigrants from Netherlands Single Father Poverty
COMPARE
Ukrainian
Immigrants from Netherlands
Single Father Poverty
Single Father Poverty Comparison
Ukrainians
Immigrants from Netherlands
16.4%
SINGLE FATHER POVERTY
30.4/ 100
METRIC RATING
187th/ 347
METRIC RANK
16.0%
SINGLE FATHER POVERTY
85.3/ 100
METRIC RATING
140th/ 347
METRIC RANK
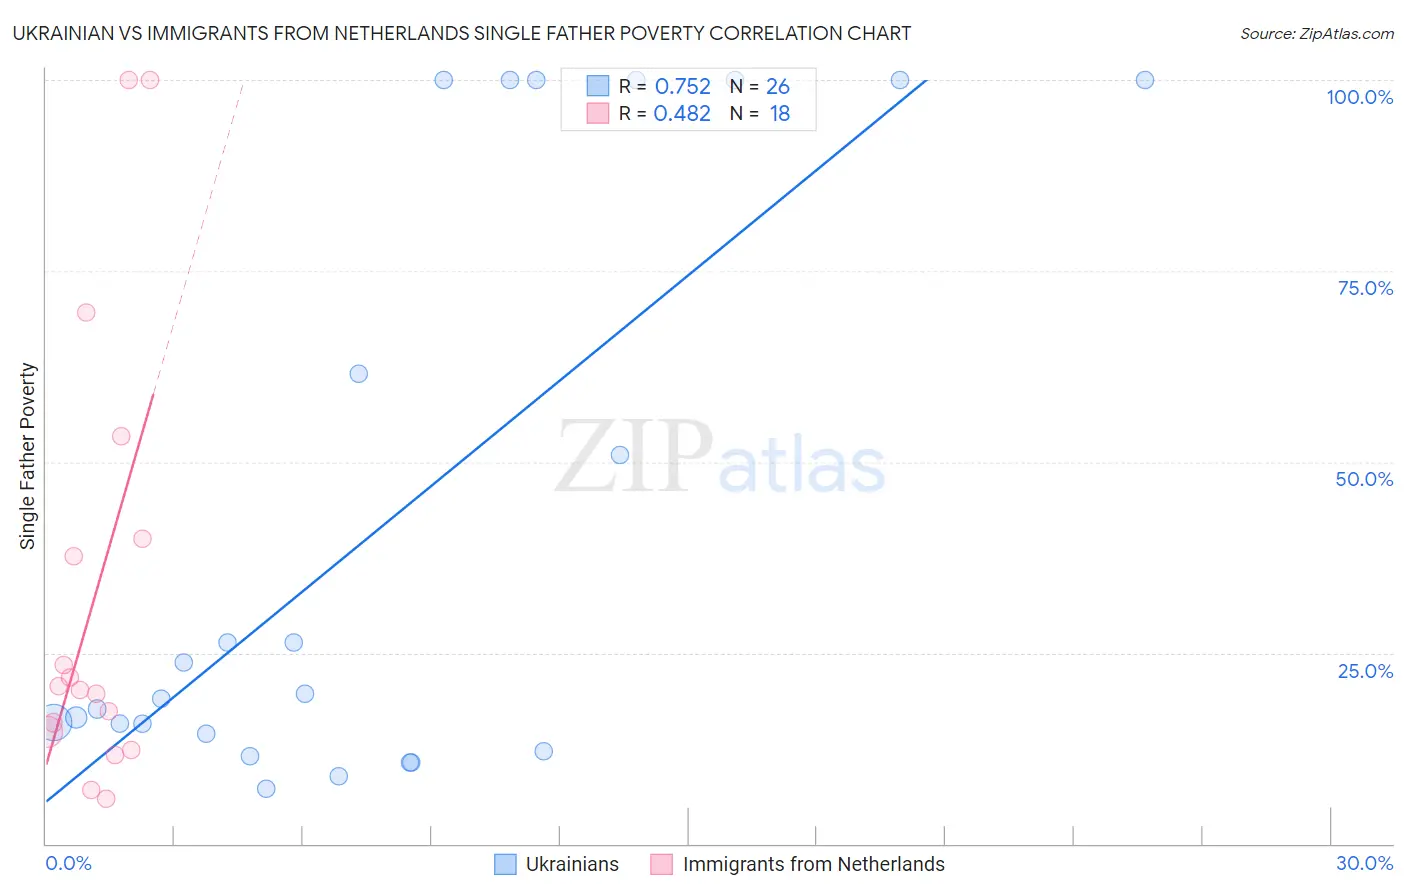
Ukrainian vs Immigrants from Netherlands Single Father Poverty Correlation Chart
The statistical analysis conducted on geographies consisting of 337,652,190 people shows a strong positive correlation between the proportion of Ukrainians and poverty level among single fathers in the United States with a correlation coefficient (R) of 0.752 and weighted average of 16.4%. Similarly, the statistical analysis conducted on geographies consisting of 195,225,242 people shows a moderate positive correlation between the proportion of Immigrants from Netherlands and poverty level among single fathers in the United States with a correlation coefficient (R) of 0.482 and weighted average of 16.0%, a difference of 2.9%.
Single Father Poverty Correlation Summary
| Measurement | Ukrainian | Immigrants from Netherlands |
| Minimum | 7.2% | 6.0% |
| Maximum | 100.0% | 100.0% |
| Range | 92.8% | 94.0% |
| Mean | 41.7% | 32.8% |
| Median | 19.4% | 20.4% |
| Interquartile 25% (IQ1) | 14.5% | 14.7% |
| Interquartile 75% (IQ3) | 100.0% | 40.0% |
| Interquartile Range (IQR) | 85.5% | 25.3% |
| Standard Deviation (Sample) | 38.0% | 29.4% |
| Standard Deviation (Population) | 37.2% | 28.6% |
Similar Demographics by Single Father Poverty
Demographics Similar to Ukrainians by Single Father Poverty
In terms of single father poverty, the demographic groups most similar to Ukrainians are Russian (16.4%, a difference of 0.020%), Immigrants from Venezuela (16.4%, a difference of 0.030%), Latvian (16.5%, a difference of 0.080%), Immigrants from Burma/Myanmar (16.5%, a difference of 0.12%), and Panamanian (16.4%, a difference of 0.16%).
| Demographics | Rating | Rank | Single Father Poverty |
| Immigrants | Latin America | 37.2 /100 | #180 | Fair 16.4% |
| Immigrants | Western Africa | 36.0 /100 | #181 | Fair 16.4% |
| Immigrants | Italy | 35.7 /100 | #182 | Fair 16.4% |
| Aleuts | 35.3 /100 | #183 | Fair 16.4% |
| Cambodians | 34.6 /100 | #184 | Fair 16.4% |
| Panamanians | 33.6 /100 | #185 | Fair 16.4% |
| Immigrants | Venezuela | 31.0 /100 | #186 | Fair 16.4% |
| Ukrainians | 30.4 /100 | #187 | Fair 16.4% |
| Russians | 30.1 /100 | #188 | Fair 16.4% |
| Latvians | 28.9 /100 | #189 | Fair 16.5% |
| Immigrants | Burma/Myanmar | 28.0 /100 | #190 | Fair 16.5% |
| Immigrants | Guyana | 27.1 /100 | #191 | Fair 16.5% |
| Immigrants | Switzerland | 24.8 /100 | #192 | Fair 16.5% |
| Ecuadorians | 24.5 /100 | #193 | Fair 16.5% |
| Cape Verdeans | 24.4 /100 | #194 | Fair 16.5% |
Demographics Similar to Immigrants from Netherlands by Single Father Poverty
In terms of single father poverty, the demographic groups most similar to Immigrants from Netherlands are South American (16.0%, a difference of 0.050%), Central American (16.0%, a difference of 0.17%), Liberian (16.0%, a difference of 0.17%), Immigrants from Mexico (16.0%, a difference of 0.17%), and Immigrants from the Azores (15.9%, a difference of 0.18%).
| Demographics | Rating | Rank | Single Father Poverty |
| Immigrants | Syria | 89.5 /100 | #133 | Excellent 15.9% |
| Immigrants | South America | 88.5 /100 | #134 | Excellent 15.9% |
| Immigrants | Sri Lanka | 88.2 /100 | #135 | Excellent 15.9% |
| Cypriots | 87.5 /100 | #136 | Excellent 15.9% |
| Immigrants | Azores | 87.2 /100 | #137 | Excellent 15.9% |
| Central Americans | 87.1 /100 | #138 | Excellent 16.0% |
| South Americans | 85.9 /100 | #139 | Excellent 16.0% |
| Immigrants | Netherlands | 85.3 /100 | #140 | Excellent 16.0% |
| Liberians | 83.3 /100 | #141 | Excellent 16.0% |
| Immigrants | Mexico | 83.3 /100 | #142 | Excellent 16.0% |
| Immigrants | Central America | 83.1 /100 | #143 | Excellent 16.0% |
| Immigrants | Kuwait | 81.4 /100 | #144 | Excellent 16.0% |
| Immigrants | Western Asia | 80.7 /100 | #145 | Excellent 16.0% |
| Immigrants | Hungary | 78.3 /100 | #146 | Good 16.1% |
| Colombians | 77.1 /100 | #147 | Good 16.1% |