Portuguese vs Immigrants from Ecuador Single Father Poverty
COMPARE
Portuguese
Immigrants from Ecuador
Single Father Poverty
Single Father Poverty Comparison
Portuguese
Immigrants from Ecuador
16.2%
SINGLE FATHER POVERTY
62.3/ 100
METRIC RATING
158th/ 347
METRIC RANK
16.3%
SINGLE FATHER POVERTY
49.7/ 100
METRIC RATING
175th/ 347
METRIC RANK
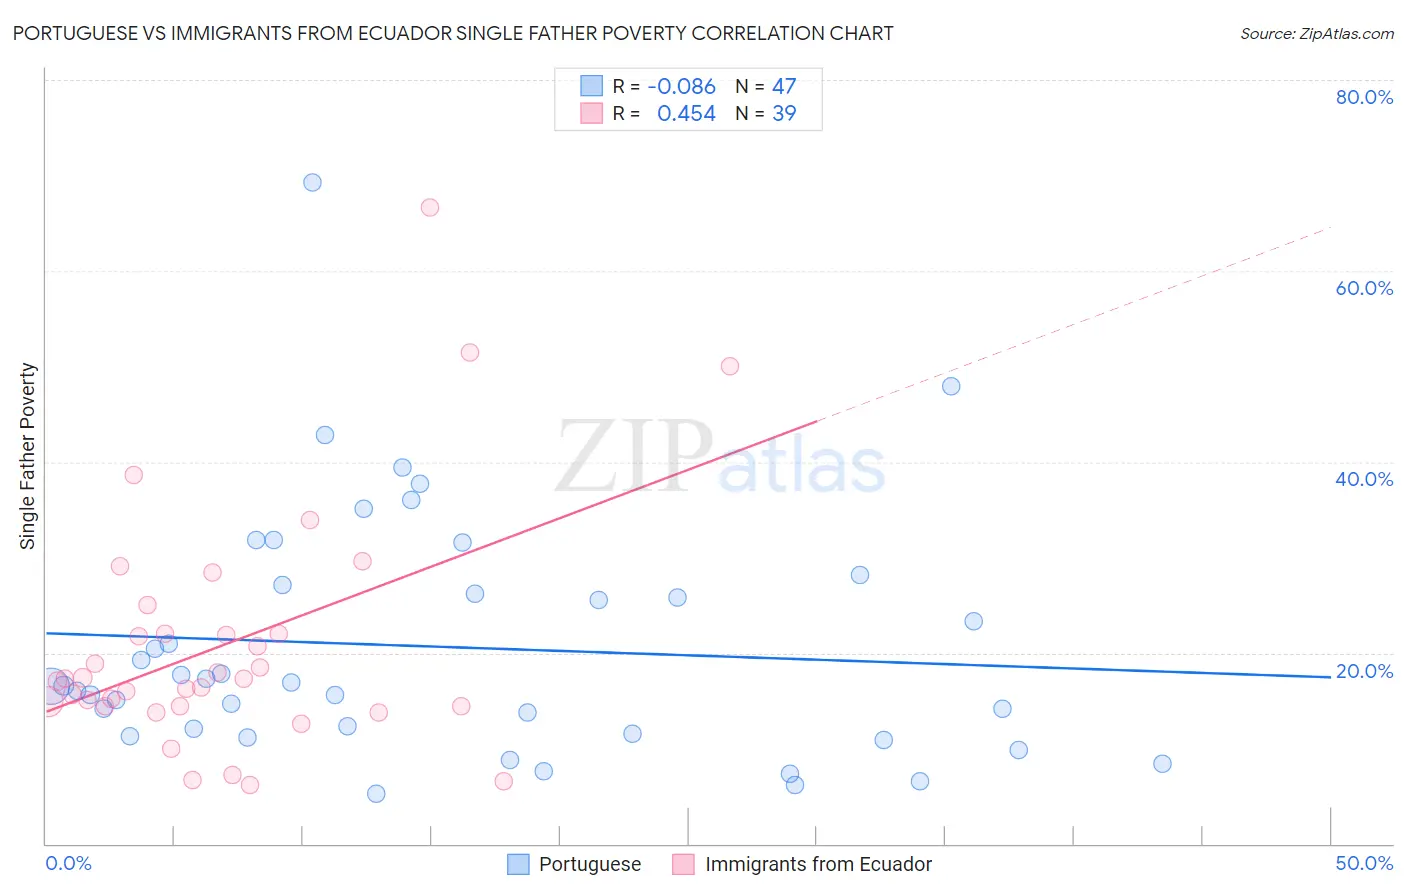
Portuguese vs Immigrants from Ecuador Single Father Poverty Correlation Chart
The statistical analysis conducted on geographies consisting of 344,973,459 people shows a slight negative correlation between the proportion of Portuguese and poverty level among single fathers in the United States with a correlation coefficient (R) of -0.086 and weighted average of 16.2%. Similarly, the statistical analysis conducted on geographies consisting of 223,687,874 people shows a moderate positive correlation between the proportion of Immigrants from Ecuador and poverty level among single fathers in the United States with a correlation coefficient (R) of 0.454 and weighted average of 16.3%, a difference of 0.57%.
Single Father Poverty Correlation Summary
| Measurement | Portuguese | Immigrants from Ecuador |
| Minimum | 5.2% | 6.2% |
| Maximum | 69.3% | 66.7% |
| Range | 64.1% | 60.5% |
| Mean | 20.6% | 20.9% |
| Median | 16.6% | 17.3% |
| Interquartile 25% (IQ1) | 11.5% | 14.3% |
| Interquartile 75% (IQ3) | 27.1% | 22.0% |
| Interquartile Range (IQR) | 15.6% | 7.7% |
| Standard Deviation (Sample) | 12.8% | 12.7% |
| Standard Deviation (Population) | 12.6% | 12.5% |
Demographics Similar to Portuguese and Immigrants from Ecuador by Single Father Poverty
In terms of single father poverty, the demographic groups most similar to Portuguese are Immigrants from Czechoslovakia (16.2%, a difference of 0.020%), Belizean (16.2%, a difference of 0.11%), Immigrants from Sudan (16.2%, a difference of 0.12%), Immigrants from Jordan (16.2%, a difference of 0.18%), and Estonian (16.2%, a difference of 0.26%). Similarly, the demographic groups most similar to Immigrants from Ecuador are Immigrants from Sierra Leone (16.3%, a difference of 0.020%), Immigrants from St. Vincent and the Grenadines (16.3%, a difference of 0.020%), Swedish (16.3%, a difference of 0.020%), Immigrants from Morocco (16.3%, a difference of 0.050%), and Vietnamese (16.3%, a difference of 0.070%).
| Demographics | Rating | Rank | Single Father Poverty |
| Immigrants | Jordan | 66.0 /100 | #156 | Good 16.2% |
| Immigrants | Czechoslovakia | 62.8 /100 | #157 | Good 16.2% |
| Portuguese | 62.3 /100 | #158 | Good 16.2% |
| Belizeans | 59.9 /100 | #159 | Average 16.2% |
| Immigrants | Sudan | 59.8 /100 | #160 | Average 16.2% |
| Estonians | 56.7 /100 | #161 | Average 16.2% |
| Ugandans | 55.9 /100 | #162 | Average 16.3% |
| Immigrants | Costa Rica | 55.7 /100 | #163 | Average 16.3% |
| Guyanese | 55.2 /100 | #164 | Average 16.3% |
| Immigrants | Bangladesh | 55.1 /100 | #165 | Average 16.3% |
| Immigrants | Europe | 54.8 /100 | #166 | Average 16.3% |
| Yugoslavians | 53.9 /100 | #167 | Average 16.3% |
| Costa Ricans | 53.6 /100 | #168 | Average 16.3% |
| Northern Europeans | 52.8 /100 | #169 | Average 16.3% |
| Scandinavians | 52.3 /100 | #170 | Average 16.3% |
| Immigrants | Morocco | 50.7 /100 | #171 | Average 16.3% |
| Immigrants | Sierra Leone | 50.1 /100 | #172 | Average 16.3% |
| Immigrants | St. Vincent and the Grenadines | 50.0 /100 | #173 | Average 16.3% |
| Swedes | 50.0 /100 | #174 | Average 16.3% |
| Immigrants | Ecuador | 49.7 /100 | #175 | Average 16.3% |
| Vietnamese | 48.0 /100 | #176 | Average 16.3% |