Portuguese vs Immigrants from Netherlands 7th Grade
COMPARE
Portuguese
Immigrants from Netherlands
7th Grade
7th Grade Comparison
Portuguese
Immigrants from Netherlands
95.8%
7TH GRADE
13.6/ 100
METRIC RATING
211th/ 347
METRIC RANK
96.8%
7TH GRADE
99.3/ 100
METRIC RATING
78th/ 347
METRIC RANK
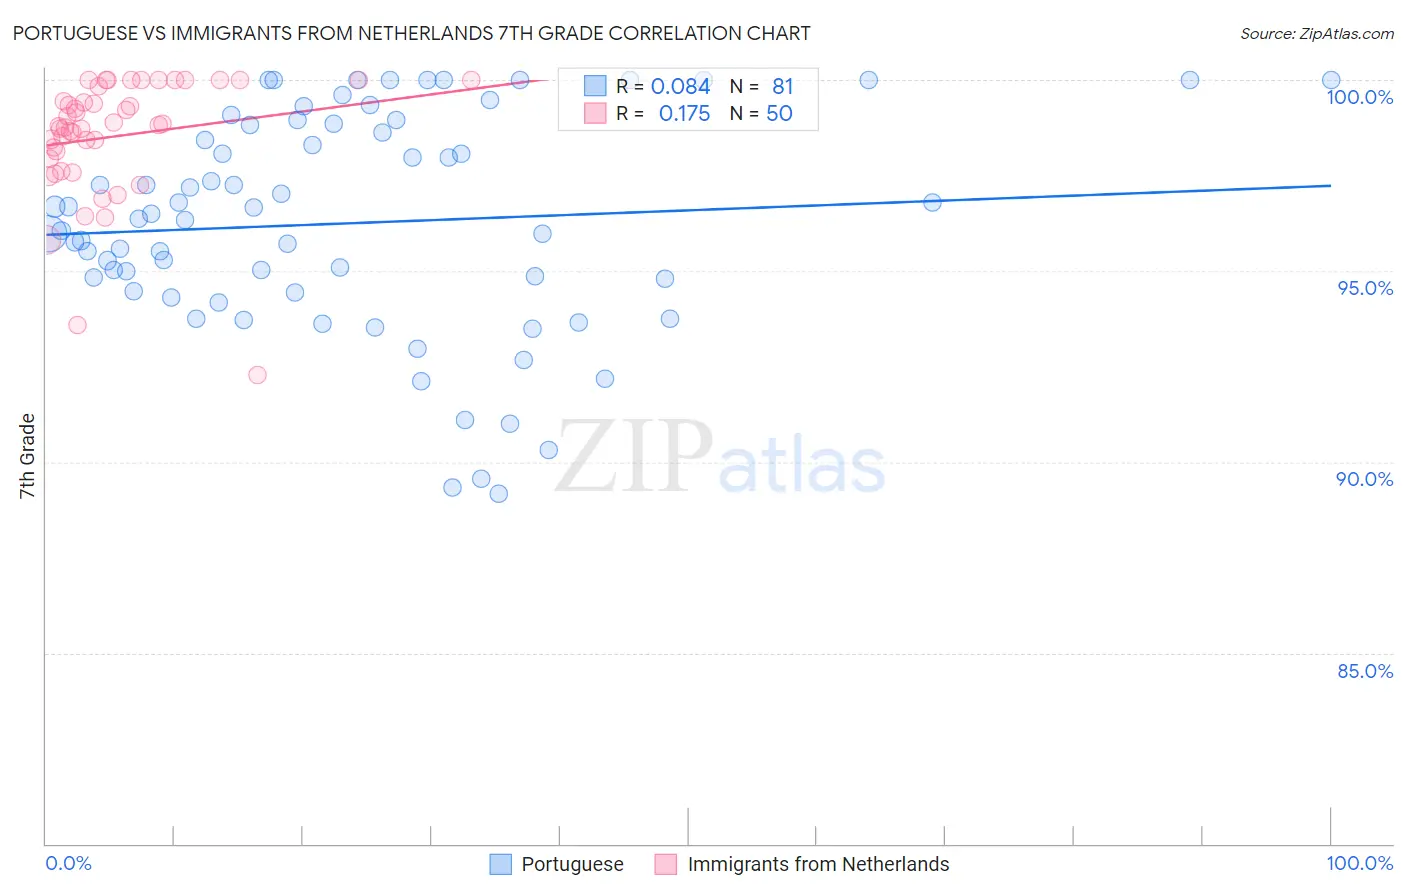
Portuguese vs Immigrants from Netherlands 7th Grade Correlation Chart
The statistical analysis conducted on geographies consisting of 450,343,001 people shows a slight positive correlation between the proportion of Portuguese and percentage of population with at least 7th grade education in the United States with a correlation coefficient (R) of 0.084 and weighted average of 95.8%. Similarly, the statistical analysis conducted on geographies consisting of 237,869,934 people shows a poor positive correlation between the proportion of Immigrants from Netherlands and percentage of population with at least 7th grade education in the United States with a correlation coefficient (R) of 0.175 and weighted average of 96.8%, a difference of 1.1%.
7th Grade Correlation Summary
| Measurement | Portuguese | Immigrants from Netherlands |
| Minimum | 89.2% | 92.3% |
| Maximum | 100.0% | 100.0% |
| Range | 10.8% | 7.7% |
| Mean | 96.3% | 98.5% |
| Median | 96.4% | 98.8% |
| Interquartile 25% (IQ1) | 94.5% | 97.9% |
| Interquartile 75% (IQ3) | 98.8% | 99.8% |
| Interquartile Range (IQR) | 4.4% | 1.9% |
| Standard Deviation (Sample) | 2.8% | 1.6% |
| Standard Deviation (Population) | 2.8% | 1.6% |
Similar Demographics by 7th Grade
Demographics Similar to Portuguese by 7th Grade
In terms of 7th grade, the demographic groups most similar to Portuguese are Immigrants from Lebanon (95.8%, a difference of 0.010%), Immigrants from Morocco (95.8%, a difference of 0.010%), Dutch West Indian (95.8%, a difference of 0.030%), Hawaiian (95.8%, a difference of 0.030%), and Bahamian (95.7%, a difference of 0.030%).
| Demographics | Rating | Rank | 7th Grade |
| Assyrians/Chaldeans/Syriacs | 20.5 /100 | #204 | Fair 95.8% |
| Moroccans | 18.9 /100 | #205 | Poor 95.8% |
| Africans | 17.6 /100 | #206 | Poor 95.8% |
| Navajo | 17.0 /100 | #207 | Poor 95.8% |
| Immigrants | Sudan | 17.0 /100 | #208 | Poor 95.8% |
| Dutch West Indians | 16.1 /100 | #209 | Poor 95.8% |
| Hawaiians | 16.0 /100 | #210 | Poor 95.8% |
| Portuguese | 13.6 /100 | #211 | Poor 95.8% |
| Immigrants | Lebanon | 13.0 /100 | #212 | Poor 95.8% |
| Immigrants | Morocco | 12.6 /100 | #213 | Poor 95.8% |
| Bahamians | 11.6 /100 | #214 | Poor 95.7% |
| Spanish Americans | 9.3 /100 | #215 | Tragic 95.7% |
| Immigrants | Chile | 9.1 /100 | #216 | Tragic 95.7% |
| Immigrants | Pakistan | 9.0 /100 | #217 | Tragic 95.7% |
| Immigrants | Liberia | 8.1 /100 | #218 | Tragic 95.7% |
Demographics Similar to Immigrants from Netherlands by 7th Grade
In terms of 7th grade, the demographic groups most similar to Immigrants from Netherlands are Cypriot (96.8%, a difference of 0.0%), Yugoslavian (96.8%, a difference of 0.0%), Immigrants from Ireland (96.8%, a difference of 0.010%), Cherokee (96.8%, a difference of 0.010%), and Delaware (96.8%, a difference of 0.020%).
| Demographics | Rating | Rank | 7th Grade |
| Immigrants | Lithuania | 99.6 /100 | #71 | Exceptional 96.8% |
| Cajuns | 99.5 /100 | #72 | Exceptional 96.8% |
| Arapaho | 99.5 /100 | #73 | Exceptional 96.8% |
| Immigrants | England | 99.5 /100 | #74 | Exceptional 96.8% |
| Zimbabweans | 99.5 /100 | #75 | Exceptional 96.8% |
| Immigrants | Ireland | 99.4 /100 | #76 | Exceptional 96.8% |
| Cherokee | 99.4 /100 | #77 | Exceptional 96.8% |
| Immigrants | Netherlands | 99.3 /100 | #78 | Exceptional 96.8% |
| Cypriots | 99.3 /100 | #79 | Exceptional 96.8% |
| Yugoslavians | 99.3 /100 | #80 | Exceptional 96.8% |
| Delaware | 99.2 /100 | #81 | Exceptional 96.8% |
| Chickasaw | 99.2 /100 | #82 | Exceptional 96.7% |
| Icelanders | 99.1 /100 | #83 | Exceptional 96.7% |
| Romanians | 99.1 /100 | #84 | Exceptional 96.7% |
| Kiowa | 99.1 /100 | #85 | Exceptional 96.7% |