Central American vs Immigrants from Netherlands Single Father Poverty
COMPARE
Central American
Immigrants from Netherlands
Single Father Poverty
Single Father Poverty Comparison
Central Americans
Immigrants from Netherlands
16.0%
SINGLE FATHER POVERTY
87.1/ 100
METRIC RATING
138th/ 347
METRIC RANK
16.0%
SINGLE FATHER POVERTY
85.3/ 100
METRIC RATING
140th/ 347
METRIC RANK
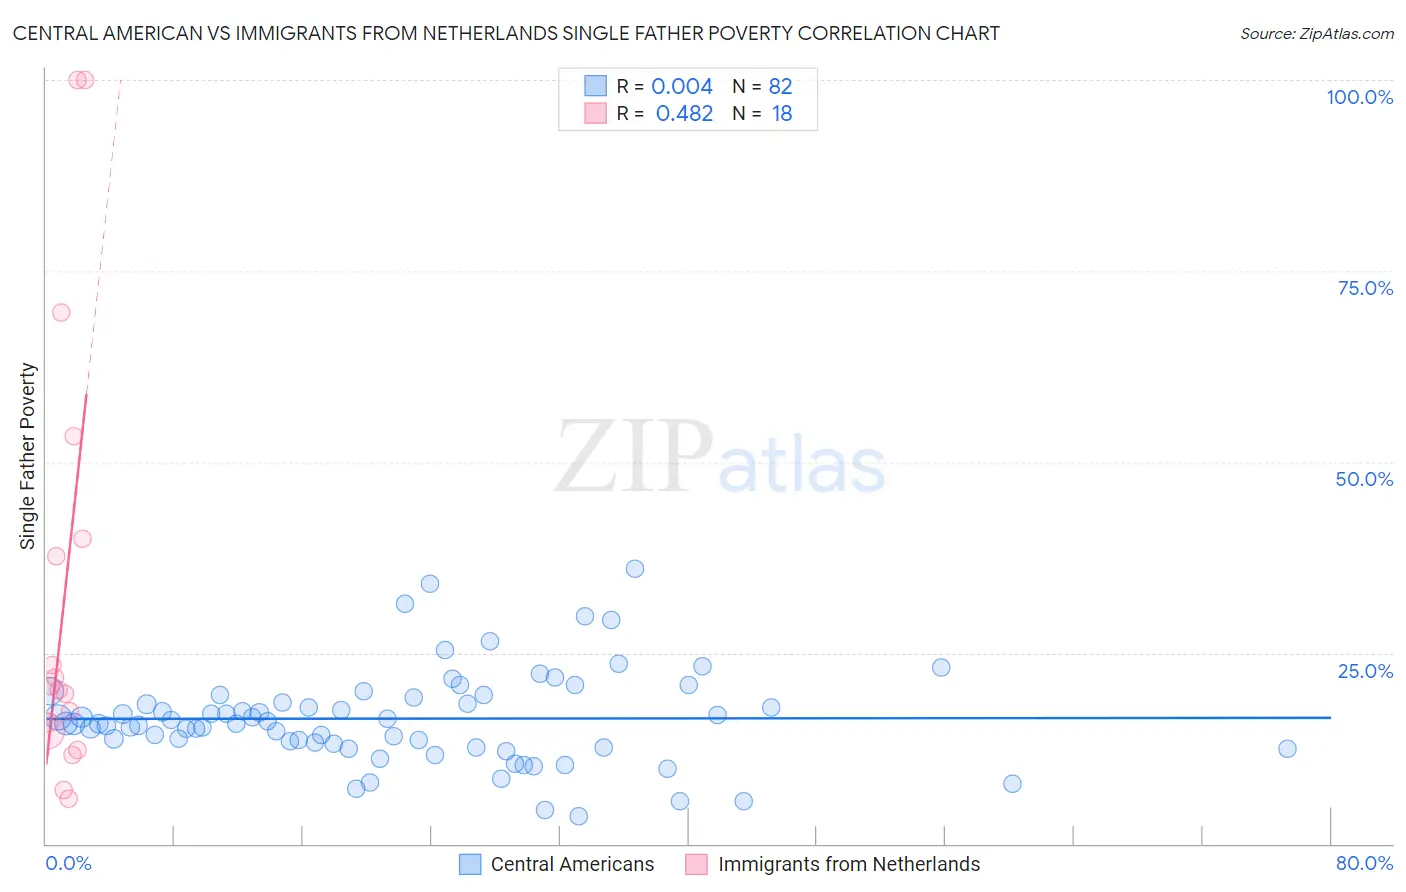
Central American vs Immigrants from Netherlands Single Father Poverty Correlation Chart
The statistical analysis conducted on geographies consisting of 382,583,767 people shows no correlation between the proportion of Central Americans and poverty level among single fathers in the United States with a correlation coefficient (R) of 0.004 and weighted average of 16.0%. Similarly, the statistical analysis conducted on geographies consisting of 195,225,242 people shows a moderate positive correlation between the proportion of Immigrants from Netherlands and poverty level among single fathers in the United States with a correlation coefficient (R) of 0.482 and weighted average of 16.0%, a difference of 0.17%.
Single Father Poverty Correlation Summary
| Measurement | Central American | Immigrants from Netherlands |
| Minimum | 3.6% | 6.0% |
| Maximum | 36.0% | 100.0% |
| Range | 32.4% | 94.0% |
| Mean | 16.4% | 32.8% |
| Median | 15.8% | 20.4% |
| Interquartile 25% (IQ1) | 13.1% | 14.7% |
| Interquartile 75% (IQ3) | 19.1% | 40.0% |
| Interquartile Range (IQR) | 6.0% | 25.3% |
| Standard Deviation (Sample) | 6.1% | 29.4% |
| Standard Deviation (Population) | 6.1% | 28.6% |
Demographics Similar to Central Americans and Immigrants from Netherlands by Single Father Poverty
In terms of single father poverty, the demographic groups most similar to Central Americans are Immigrants from the Azores (15.9%, a difference of 0.010%), Cypriot (15.9%, a difference of 0.040%), Immigrants from Sri Lanka (15.9%, a difference of 0.11%), South American (16.0%, a difference of 0.12%), and Immigrants from South America (15.9%, a difference of 0.14%). Similarly, the demographic groups most similar to Immigrants from Netherlands are South American (16.0%, a difference of 0.050%), Liberian (16.0%, a difference of 0.17%), Immigrants from Mexico (16.0%, a difference of 0.17%), Immigrants from the Azores (15.9%, a difference of 0.18%), and Immigrants from Central America (16.0%, a difference of 0.19%).
| Demographics | Rating | Rank | Single Father Poverty |
| Immigrants | West Indies | 90.8 /100 | #129 | Exceptional 15.9% |
| Norwegians | 90.2 /100 | #130 | Exceptional 15.9% |
| Nicaraguans | 90.1 /100 | #131 | Exceptional 15.9% |
| Immigrants | Portugal | 89.7 /100 | #132 | Excellent 15.9% |
| Immigrants | Syria | 89.5 /100 | #133 | Excellent 15.9% |
| Immigrants | South America | 88.5 /100 | #134 | Excellent 15.9% |
| Immigrants | Sri Lanka | 88.2 /100 | #135 | Excellent 15.9% |
| Cypriots | 87.5 /100 | #136 | Excellent 15.9% |
| Immigrants | Azores | 87.2 /100 | #137 | Excellent 15.9% |
| Central Americans | 87.1 /100 | #138 | Excellent 16.0% |
| South Americans | 85.9 /100 | #139 | Excellent 16.0% |
| Immigrants | Netherlands | 85.3 /100 | #140 | Excellent 16.0% |
| Liberians | 83.3 /100 | #141 | Excellent 16.0% |
| Immigrants | Mexico | 83.3 /100 | #142 | Excellent 16.0% |
| Immigrants | Central America | 83.1 /100 | #143 | Excellent 16.0% |
| Immigrants | Kuwait | 81.4 /100 | #144 | Excellent 16.0% |
| Immigrants | Western Asia | 80.7 /100 | #145 | Excellent 16.0% |
| Immigrants | Hungary | 78.3 /100 | #146 | Good 16.1% |
| Colombians | 77.1 /100 | #147 | Good 16.1% |
| Nigerians | 76.8 /100 | #148 | Good 16.1% |
| South Africans | 75.1 /100 | #149 | Good 16.1% |