Icelander vs Immigrants from Netherlands Single Father Poverty
COMPARE
Icelander
Immigrants from Netherlands
Single Father Poverty
Single Father Poverty Comparison
Icelanders
Immigrants from Netherlands
14.5%
SINGLE FATHER POVERTY
100.0/ 100
METRIC RATING
31st/ 347
METRIC RANK
16.0%
SINGLE FATHER POVERTY
85.3/ 100
METRIC RATING
140th/ 347
METRIC RANK
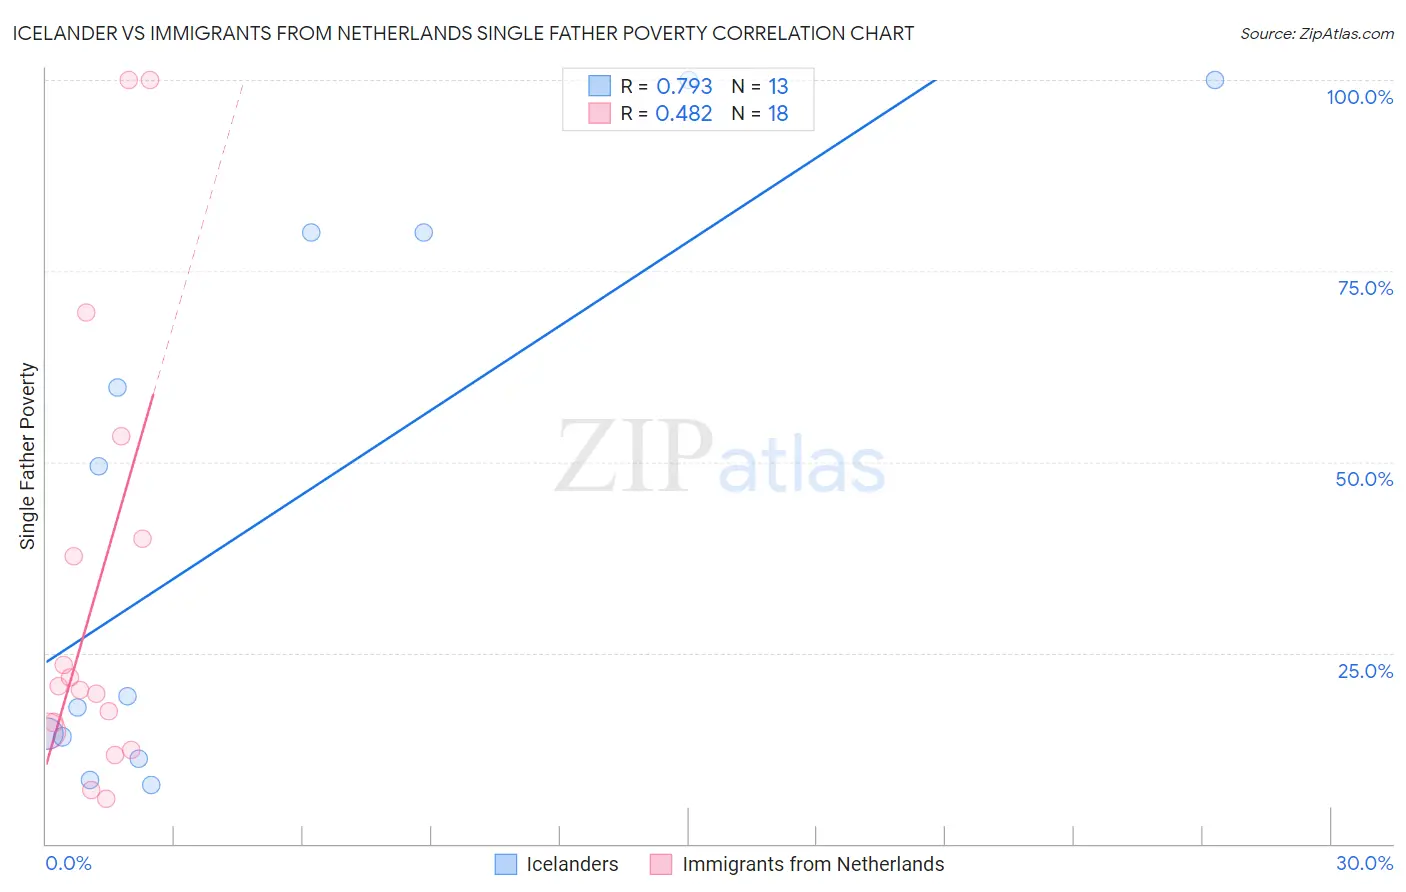
Icelander vs Immigrants from Netherlands Single Father Poverty Correlation Chart
The statistical analysis conducted on geographies consisting of 135,441,299 people shows a strong positive correlation between the proportion of Icelanders and poverty level among single fathers in the United States with a correlation coefficient (R) of 0.793 and weighted average of 14.5%. Similarly, the statistical analysis conducted on geographies consisting of 195,225,242 people shows a moderate positive correlation between the proportion of Immigrants from Netherlands and poverty level among single fathers in the United States with a correlation coefficient (R) of 0.482 and weighted average of 16.0%, a difference of 9.9%.
Single Father Poverty Correlation Summary
| Measurement | Icelander | Immigrants from Netherlands |
| Minimum | 7.7% | 6.0% |
| Maximum | 100.0% | 100.0% |
| Range | 92.3% | 94.0% |
| Mean | 43.2% | 32.8% |
| Median | 19.3% | 20.4% |
| Interquartile 25% (IQ1) | 12.6% | 14.7% |
| Interquartile 75% (IQ3) | 80.0% | 40.0% |
| Interquartile Range (IQR) | 67.4% | 25.3% |
| Standard Deviation (Sample) | 36.4% | 29.4% |
| Standard Deviation (Population) | 34.9% | 28.6% |
Similar Demographics by Single Father Poverty
Demographics Similar to Icelanders by Single Father Poverty
In terms of single father poverty, the demographic groups most similar to Icelanders are Thai (14.5%, a difference of 0.080%), Somali (14.5%, a difference of 0.13%), Asian (14.6%, a difference of 0.15%), Immigrants from South Central Asia (14.5%, a difference of 0.23%), and Okinawan (14.6%, a difference of 0.71%).
| Demographics | Rating | Rank | Single Father Poverty |
| Immigrants | South Eastern Asia | 100.0 /100 | #24 | Exceptional 14.4% |
| Iranians | 100.0 /100 | #25 | Exceptional 14.4% |
| Spanish American Indians | 100.0 /100 | #26 | Exceptional 14.4% |
| Nepalese | 100.0 /100 | #27 | Exceptional 14.4% |
| Immigrants | South Central Asia | 100.0 /100 | #28 | Exceptional 14.5% |
| Somalis | 100.0 /100 | #29 | Exceptional 14.5% |
| Thais | 100.0 /100 | #30 | Exceptional 14.5% |
| Icelanders | 100.0 /100 | #31 | Exceptional 14.5% |
| Asians | 100.0 /100 | #32 | Exceptional 14.6% |
| Okinawans | 100.0 /100 | #33 | Exceptional 14.6% |
| Egyptians | 100.0 /100 | #34 | Exceptional 14.7% |
| Immigrants | Bolivia | 100.0 /100 | #35 | Exceptional 14.7% |
| Immigrants | Indonesia | 100.0 /100 | #36 | Exceptional 14.7% |
| Immigrants | Eastern Africa | 100.0 /100 | #37 | Exceptional 14.7% |
| Bolivians | 100.0 /100 | #38 | Exceptional 14.7% |
Demographics Similar to Immigrants from Netherlands by Single Father Poverty
In terms of single father poverty, the demographic groups most similar to Immigrants from Netherlands are South American (16.0%, a difference of 0.050%), Central American (16.0%, a difference of 0.17%), Liberian (16.0%, a difference of 0.17%), Immigrants from Mexico (16.0%, a difference of 0.17%), and Immigrants from the Azores (15.9%, a difference of 0.18%).
| Demographics | Rating | Rank | Single Father Poverty |
| Immigrants | Syria | 89.5 /100 | #133 | Excellent 15.9% |
| Immigrants | South America | 88.5 /100 | #134 | Excellent 15.9% |
| Immigrants | Sri Lanka | 88.2 /100 | #135 | Excellent 15.9% |
| Cypriots | 87.5 /100 | #136 | Excellent 15.9% |
| Immigrants | Azores | 87.2 /100 | #137 | Excellent 15.9% |
| Central Americans | 87.1 /100 | #138 | Excellent 16.0% |
| South Americans | 85.9 /100 | #139 | Excellent 16.0% |
| Immigrants | Netherlands | 85.3 /100 | #140 | Excellent 16.0% |
| Liberians | 83.3 /100 | #141 | Excellent 16.0% |
| Immigrants | Mexico | 83.3 /100 | #142 | Excellent 16.0% |
| Immigrants | Central America | 83.1 /100 | #143 | Excellent 16.0% |
| Immigrants | Kuwait | 81.4 /100 | #144 | Excellent 16.0% |
| Immigrants | Western Asia | 80.7 /100 | #145 | Excellent 16.0% |
| Immigrants | Hungary | 78.3 /100 | #146 | Good 16.1% |
| Colombians | 77.1 /100 | #147 | Good 16.1% |