Portuguese vs Yuman Single Father Poverty
COMPARE
Portuguese
Yuman
Single Father Poverty
Single Father Poverty Comparison
Portuguese
Yuman
16.2%
SINGLE FATHER POVERTY
62.3/ 100
METRIC RATING
158th/ 347
METRIC RANK
28.4%
SINGLE FATHER POVERTY
0.0/ 100
METRIC RATING
342nd/ 347
METRIC RANK
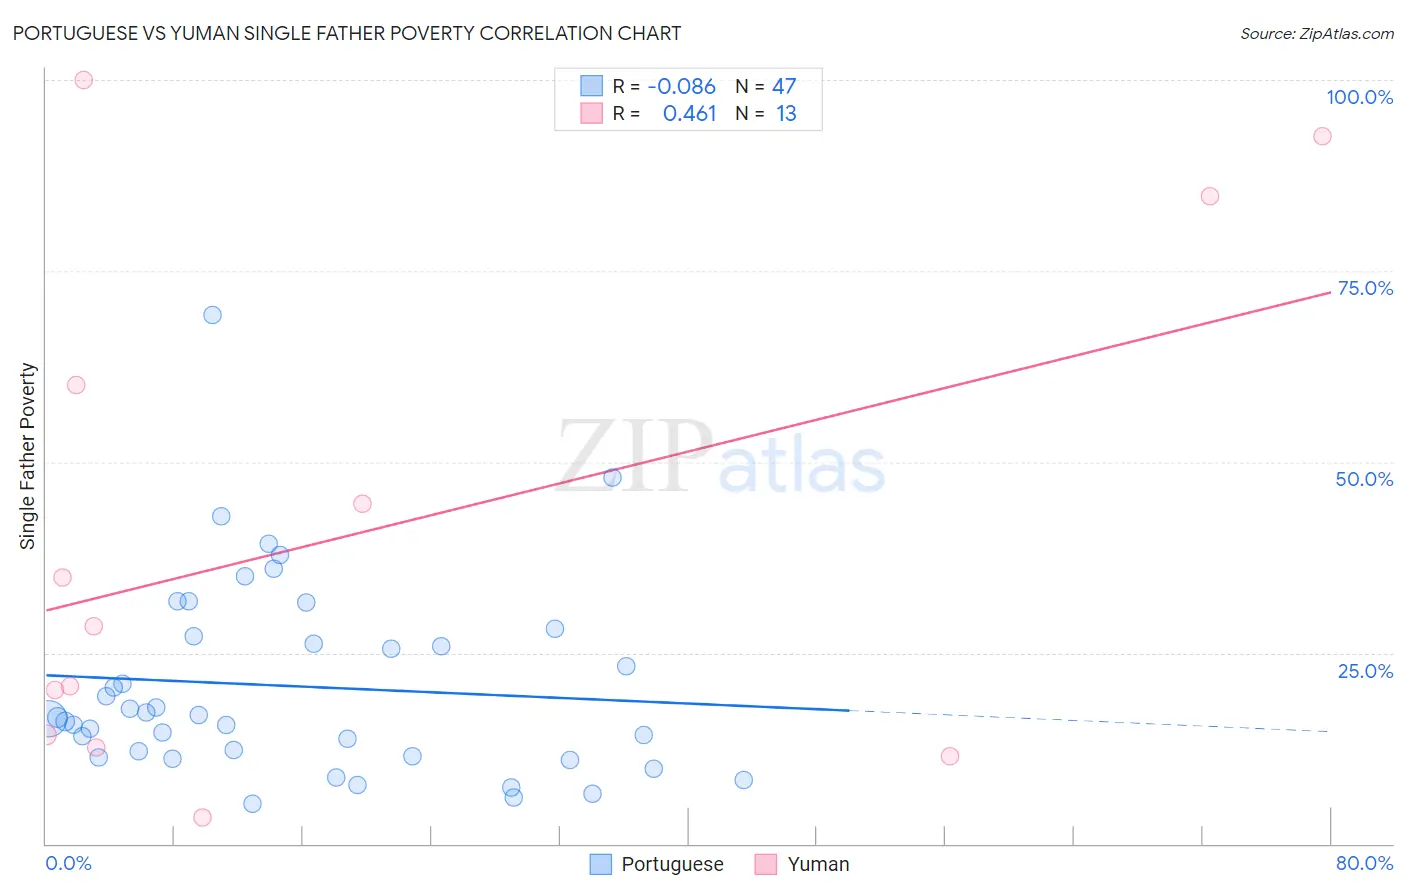
Portuguese vs Yuman Single Father Poverty Correlation Chart
The statistical analysis conducted on geographies consisting of 344,973,459 people shows a slight negative correlation between the proportion of Portuguese and poverty level among single fathers in the United States with a correlation coefficient (R) of -0.086 and weighted average of 16.2%. Similarly, the statistical analysis conducted on geographies consisting of 39,127,530 people shows a moderate positive correlation between the proportion of Yuman and poverty level among single fathers in the United States with a correlation coefficient (R) of 0.461 and weighted average of 28.4%, a difference of 75.2%.
Single Father Poverty Correlation Summary
| Measurement | Portuguese | Yuman |
| Minimum | 5.2% | 3.4% |
| Maximum | 69.3% | 100.0% |
| Range | 64.1% | 96.6% |
| Mean | 20.6% | 40.6% |
| Median | 16.6% | 28.5% |
| Interquartile 25% (IQ1) | 11.5% | 13.4% |
| Interquartile 75% (IQ3) | 27.1% | 72.4% |
| Interquartile Range (IQR) | 15.6% | 58.9% |
| Standard Deviation (Sample) | 12.8% | 33.3% |
| Standard Deviation (Population) | 12.6% | 32.0% |
Similar Demographics by Single Father Poverty
Demographics Similar to Portuguese by Single Father Poverty
In terms of single father poverty, the demographic groups most similar to Portuguese are Immigrants from Czechoslovakia (16.2%, a difference of 0.020%), Belizean (16.2%, a difference of 0.11%), Immigrants from Sudan (16.2%, a difference of 0.12%), Immigrants from Jordan (16.2%, a difference of 0.18%), and Estonian (16.2%, a difference of 0.26%).
| Demographics | Rating | Rank | Single Father Poverty |
| Immigrants | France | 73.1 /100 | #151 | Good 16.1% |
| Immigrants | Zimbabwe | 72.1 /100 | #152 | Good 16.1% |
| Immigrants | Israel | 72.0 /100 | #153 | Good 16.1% |
| Mexicans | 70.1 /100 | #154 | Good 16.1% |
| Immigrants | Nicaragua | 67.8 /100 | #155 | Good 16.2% |
| Immigrants | Jordan | 66.0 /100 | #156 | Good 16.2% |
| Immigrants | Czechoslovakia | 62.8 /100 | #157 | Good 16.2% |
| Portuguese | 62.3 /100 | #158 | Good 16.2% |
| Belizeans | 59.9 /100 | #159 | Average 16.2% |
| Immigrants | Sudan | 59.8 /100 | #160 | Average 16.2% |
| Estonians | 56.7 /100 | #161 | Average 16.2% |
| Ugandans | 55.9 /100 | #162 | Average 16.3% |
| Immigrants | Costa Rica | 55.7 /100 | #163 | Average 16.3% |
| Guyanese | 55.2 /100 | #164 | Average 16.3% |
| Immigrants | Bangladesh | 55.1 /100 | #165 | Average 16.3% |
Demographics Similar to Yuman by Single Father Poverty
In terms of single father poverty, the demographic groups most similar to Yuman are Lumbee (28.5%, a difference of 0.33%), Navajo (29.2%, a difference of 2.9%), Hopi (27.2%, a difference of 4.5%), Houma (26.7%, a difference of 6.2%), and Crow (30.3%, a difference of 6.7%).
| Demographics | Rating | Rank | Single Father Poverty |
| Natives/Alaskans | 0.0 /100 | #333 | Tragic 22.4% |
| Kiowa | 0.0 /100 | #334 | Tragic 22.5% |
| Shoshone | 0.0 /100 | #335 | Tragic 22.9% |
| Cajuns | 0.0 /100 | #336 | Tragic 23.1% |
| Sioux | 0.0 /100 | #337 | Tragic 23.9% |
| Arapaho | 0.0 /100 | #338 | Tragic 24.0% |
| Apache | 0.0 /100 | #339 | Tragic 24.2% |
| Houma | 0.0 /100 | #340 | Tragic 26.7% |
| Hopi | 0.0 /100 | #341 | Tragic 27.2% |
| Yuman | 0.0 /100 | #342 | Tragic 28.4% |
| Lumbee | 0.0 /100 | #343 | Tragic 28.5% |
| Navajo | 0.0 /100 | #344 | Tragic 29.2% |
| Crow | 0.0 /100 | #345 | Tragic 30.3% |
| Puerto Ricans | 0.0 /100 | #346 | Tragic 31.5% |
| Yup'ik | 0.0 /100 | #347 | Tragic 32.5% |