Liberian vs Immigrants from Burma/Myanmar Single Father Poverty
COMPARE
Liberian
Immigrants from Burma/Myanmar
Single Father Poverty
Single Father Poverty Comparison
Liberians
Immigrants from Burma/Myanmar
16.0%
SINGLE FATHER POVERTY
83.3/ 100
METRIC RATING
141st/ 347
METRIC RANK
16.5%
SINGLE FATHER POVERTY
28.0/ 100
METRIC RATING
190th/ 347
METRIC RANK
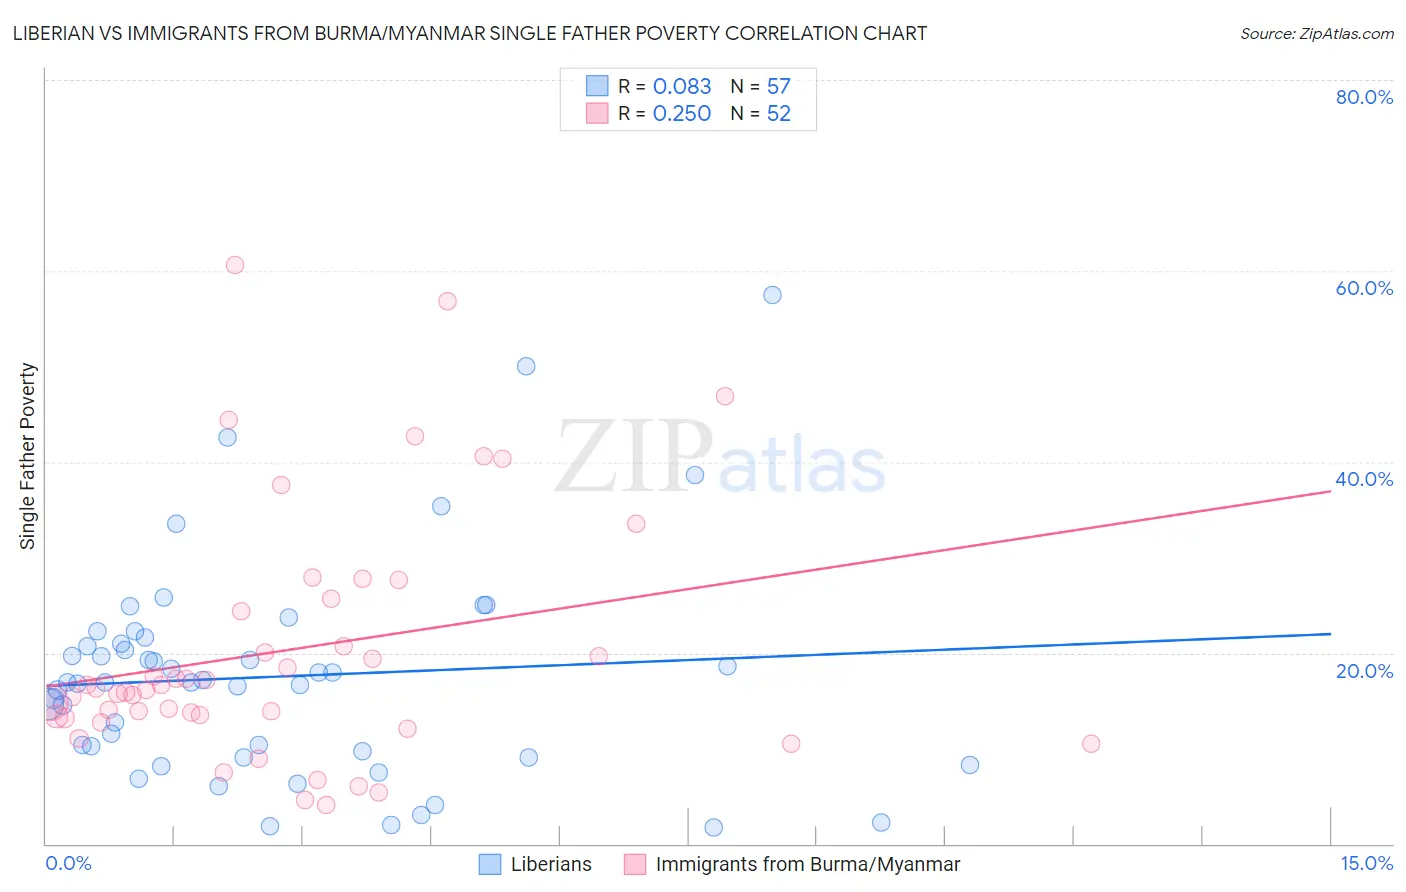
Liberian vs Immigrants from Burma/Myanmar Single Father Poverty Correlation Chart
The statistical analysis conducted on geographies consisting of 107,628,727 people shows a slight positive correlation between the proportion of Liberians and poverty level among single fathers in the United States with a correlation coefficient (R) of 0.083 and weighted average of 16.0%. Similarly, the statistical analysis conducted on geographies consisting of 151,197,682 people shows a weak positive correlation between the proportion of Immigrants from Burma/Myanmar and poverty level among single fathers in the United States with a correlation coefficient (R) of 0.250 and weighted average of 16.5%, a difference of 2.9%.
Single Father Poverty Correlation Summary
| Measurement | Liberian | Immigrants from Burma/Myanmar |
| Minimum | 1.7% | 4.1% |
| Maximum | 57.4% | 60.6% |
| Range | 55.7% | 56.5% |
| Mean | 17.5% | 20.3% |
| Median | 16.9% | 16.1% |
| Interquartile 25% (IQ1) | 9.4% | 13.3% |
| Interquartile 75% (IQ3) | 21.3% | 25.0% |
| Interquartile Range (IQR) | 11.9% | 11.8% |
| Standard Deviation (Sample) | 11.3% | 13.0% |
| Standard Deviation (Population) | 11.2% | 12.9% |
Similar Demographics by Single Father Poverty
Demographics Similar to Liberians by Single Father Poverty
In terms of single father poverty, the demographic groups most similar to Liberians are Immigrants from Mexico (16.0%, a difference of 0.0%), Immigrants from Central America (16.0%, a difference of 0.020%), Immigrants from Kuwait (16.0%, a difference of 0.15%), Immigrants from Netherlands (16.0%, a difference of 0.17%), and Immigrants from Western Asia (16.0%, a difference of 0.20%).
| Demographics | Rating | Rank | Single Father Poverty |
| Immigrants | South America | 88.5 /100 | #134 | Excellent 15.9% |
| Immigrants | Sri Lanka | 88.2 /100 | #135 | Excellent 15.9% |
| Cypriots | 87.5 /100 | #136 | Excellent 15.9% |
| Immigrants | Azores | 87.2 /100 | #137 | Excellent 15.9% |
| Central Americans | 87.1 /100 | #138 | Excellent 16.0% |
| South Americans | 85.9 /100 | #139 | Excellent 16.0% |
| Immigrants | Netherlands | 85.3 /100 | #140 | Excellent 16.0% |
| Liberians | 83.3 /100 | #141 | Excellent 16.0% |
| Immigrants | Mexico | 83.3 /100 | #142 | Excellent 16.0% |
| Immigrants | Central America | 83.1 /100 | #143 | Excellent 16.0% |
| Immigrants | Kuwait | 81.4 /100 | #144 | Excellent 16.0% |
| Immigrants | Western Asia | 80.7 /100 | #145 | Excellent 16.0% |
| Immigrants | Hungary | 78.3 /100 | #146 | Good 16.1% |
| Colombians | 77.1 /100 | #147 | Good 16.1% |
| Nigerians | 76.8 /100 | #148 | Good 16.1% |
Demographics Similar to Immigrants from Burma/Myanmar by Single Father Poverty
In terms of single father poverty, the demographic groups most similar to Immigrants from Burma/Myanmar are Latvian (16.5%, a difference of 0.050%), Immigrants from Guyana (16.5%, a difference of 0.050%), Russian (16.4%, a difference of 0.11%), Ukrainian (16.4%, a difference of 0.12%), and Immigrants from Venezuela (16.4%, a difference of 0.16%).
| Demographics | Rating | Rank | Single Father Poverty |
| Aleuts | 35.3 /100 | #183 | Fair 16.4% |
| Cambodians | 34.6 /100 | #184 | Fair 16.4% |
| Panamanians | 33.6 /100 | #185 | Fair 16.4% |
| Immigrants | Venezuela | 31.0 /100 | #186 | Fair 16.4% |
| Ukrainians | 30.4 /100 | #187 | Fair 16.4% |
| Russians | 30.1 /100 | #188 | Fair 16.4% |
| Latvians | 28.9 /100 | #189 | Fair 16.5% |
| Immigrants | Burma/Myanmar | 28.0 /100 | #190 | Fair 16.5% |
| Immigrants | Guyana | 27.1 /100 | #191 | Fair 16.5% |
| Immigrants | Switzerland | 24.8 /100 | #192 | Fair 16.5% |
| Ecuadorians | 24.5 /100 | #193 | Fair 16.5% |
| Cape Verdeans | 24.4 /100 | #194 | Fair 16.5% |
| Immigrants | Barbados | 24.3 /100 | #195 | Fair 16.5% |
| Immigrants | Canada | 21.9 /100 | #196 | Fair 16.5% |
| Immigrants | Northern Europe | 20.3 /100 | #197 | Fair 16.5% |