Arab vs Immigrants from Burma/Myanmar Single Father Poverty

COMPARE

Arab
Race
Ancestry
AfghanAfricanAlaska NativeAlaskan AthabascanAlbanianAleutAlsatianAmericanApacheArabArapahoArgentineanArmenianAssyrian/Chaldean/SyriacAustralianAustrianBahamianBangladeshiBarbadianBasqueBelgianBelizeanBermudanBhutaneseBlackfeetBolivianBrazilianBritishBritish West IndianBulgarianBurmeseCajunCambodianCanadianCape VerdeanCarpatho RusynCelticCentral AmericanCentral American IndianCherokeeCheyenneChickasawChileanChineseChippewaChoctawColombianColvilleComancheCosta RicanCreeCreekCroatianCrowCubanCypriotCzechCzechoslovakianDanishDelawareDominicanDutchDutch West IndianEastern EuropeanEcuadorianEgyptianEnglishEstonianEthiopianEuropeanFijianFilipinoFinnishFrenchFrench American IndianFrench CanadianGermanGerman RussianGhanaianGreekGuamanian/ChamorroGuatemalanGuyaneseHaitianHmongHonduranHopiHoumaHungarianIcelanderIndian (Asian)IndonesianInupiatIranianIraqiIrishIroquoisIsraeliItalianJamaicanJapaneseJordanianKenyanKiowaKoreanLaotianLatvianLebaneseLiberianLithuanianLumbeeLuxembourgerMacedonianMalaysianMalteseMarshalleseMenomineeMexicanMexican American IndianMongolianMoroccanNative HawaiianNavajoNepaleseNew ZealanderNicaraguanNigerianNorthern EuropeanNorwegianOkinawanOsageOttawaPaiutePakistaniPalestinianPanamanianParaguayanPennsylvania GermanPeruvianPimaPolishPortuguesePotawatomiPuebloPuerto RicanPuget Sound SalishRomanianRussianSalvadoranSamoanScandinavianScotch-IrishScottishSeminoleSenegaleseSerbianShoshoneSierra LeoneanSiouxSlavicSlovakSloveneSomaliSouth AfricanSouth AmericanSouth American IndianSoviet UnionSpaniardSpanishSpanish AmericanSpanish American IndianSri LankanSubsaharan AfricanSudaneseSwedishSwissSyrianTaiwaneseThaiTlingit-HaidaTohono O'OdhamTonganTrinidadian and TobagonianTsimshianTurkishU.S. Virgin IslanderUgandanUkrainianUruguayanUteVenezuelanVietnameseWelshWest IndianYakamaYaquiYugoslavianYumanYup'ikZimbabwean
Immigration
NonimmigrantsImmigrantsAfghanistanAfricaAlbaniaArgentinaArmeniaAsiaAustraliaAustriaBahamasBangladeshBarbadosBelarusBelgiumBelizeBoliviaBosnia and HerzegovinaBrazilBulgariaCabo VerdeCambodiaCameroonCanadaCaribbeanCentral AmericaChileChinaColombiaCongoCosta RicaCroatiaCubaCzechoslovakiaDenmarkDominicaDominican RepublicEastern AfricaEastern AsiaEastern EuropeEcuadorEgyptEl SalvadorEnglandEritreaEthiopiaEuropeFijiFranceGermanyGhanaGreeceGrenadaGuatemalaGuyanaHaitiHondurasHong KongHungaryIndiaIndonesiaIranIraqIrelandIsraelItalyJamaicaJapanJordanKazakhstanKenyaKoreaKuwaitLaosLatin AmericaLatviaLebanonLiberiaLithuaniaMalaysiaMexicoMicronesiaMiddle AfricaMoldovaMoroccoNepalNetherlandsNicaraguaNigeriaNorth AmericaNorth MacedoniaNorthern AfricaNorthern EuropeNorwayOceaniaPakistanPanamaPeruPhilippinesPolandPortugalRomaniaRussiaSaudi ArabiaScotlandSenegalSerbiaSierra LeoneSingaporeSomaliaSouth AfricaSouth AmericaSouth Central AsiaSouth Eastern AsiaSouthern EuropeSpainSri LankaSt. Vincent and the GrenadinesSudanSwedenSwitzerlandSyriaTaiwanThailandTrinidad and TobagoTurkeyUgandaUkraineUruguayUzbekistanVenezuelaVietnamWest IndiesWestern AfricaWestern AsiaWestern EuropeYemenZaireZimbabweAzores
Immigrants from Burma/Myanmar
Race
Ancestry
AfghanAfricanAlaska NativeAlaskan AthabascanAlbanianAleutAlsatianAmericanApacheArapahoArgentineanArmenianAssyrian/Chaldean/SyriacAustralianAustrianBahamianBangladeshiBarbadianBasqueBelgianBelizeanBermudanBhutaneseBlackfeetBolivianBrazilianBritishBritish West IndianBulgarianBurmeseCajunCambodianCanadianCape VerdeanCarpatho RusynCelticCentral AmericanCentral American IndianCherokeeCheyenneChickasawChileanChineseChippewaChoctawColombianColvilleComancheCosta RicanCreeCreekCroatianCrowCubanCypriotCzechCzechoslovakianDanishDelawareDominicanDutchDutch West IndianEastern EuropeanEcuadorianEgyptianEnglishEstonianEthiopianEuropeanFijianFilipinoFinnishFrenchFrench American IndianFrench CanadianGermanGerman RussianGhanaianGreekGuamanian/ChamorroGuatemalanGuyaneseHaitianHmongHonduranHopiHoumaHungarianIcelanderIndian (Asian)IndonesianInupiatIranianIraqiIrishIroquoisIsraeliItalianJamaicanJapaneseJordanianKenyanKiowaKoreanLaotianLatvianLebaneseLiberianLithuanianLumbeeLuxembourgerMacedonianMalaysianMalteseMarshalleseMenomineeMexicanMexican American IndianMongolianMoroccanNative HawaiianNavajoNepaleseNew ZealanderNicaraguanNigerianNorthern EuropeanNorwegianOkinawanOsageOttawaPaiutePakistaniPalestinianPanamanianParaguayanPennsylvania GermanPeruvianPimaPolishPortuguesePotawatomiPuebloPuerto RicanPuget Sound SalishRomanianRussianSalvadoranSamoanScandinavianScotch-IrishScottishSeminoleSenegaleseSerbianShoshoneSierra LeoneanSiouxSlavicSlovakSloveneSomaliSouth AfricanSouth AmericanSouth American IndianSoviet UnionSpaniardSpanishSpanish AmericanSpanish American IndianSri LankanSubsaharan AfricanSudaneseSwedishSwissSyrianTaiwaneseThaiTlingit-HaidaTohono O'OdhamTonganTrinidadian and TobagonianTsimshianTurkishU.S. Virgin IslanderUgandanUkrainianUruguayanUteVenezuelanVietnameseWelshWest IndianYakamaYaquiYugoslavianYumanYup'ikZimbabwean
Immigration
NonimmigrantsImmigrantsAfghanistanAfricaAlbaniaArgentinaArmeniaAsiaAustraliaAustriaBahamasBangladeshBarbadosBelarusBelgiumBelizeBoliviaBosnia and HerzegovinaBrazilBulgariaBurma/MyanmarCabo VerdeCambodiaCameroonCanadaCaribbeanCentral AmericaChileChinaColombiaCongoCosta RicaCroatiaCubaCzechoslovakiaDenmarkDominicaDominican RepublicEastern AfricaEastern AsiaEastern EuropeEcuadorEgyptEl SalvadorEnglandEritreaEthiopiaEuropeFijiFranceGermanyGhanaGreeceGrenadaGuatemalaGuyanaHaitiHondurasHong KongHungaryIndiaIndonesiaIranIraqIrelandIsraelItalyJamaicaJapanJordanKazakhstanKenyaKoreaKuwaitLaosLatin AmericaLatviaLebanonLiberiaLithuaniaMalaysiaMexicoMicronesiaMiddle AfricaMoldovaMoroccoNepalNetherlandsNicaraguaNigeriaNorth AmericaNorth MacedoniaNorthern AfricaNorthern EuropeNorwayOceaniaPakistanPanamaPeruPhilippinesPolandPortugalRomaniaRussiaSaudi ArabiaScotlandSenegalSerbiaSierra LeoneSingaporeSomaliaSouth AfricaSouth AmericaSouth Central AsiaSouth Eastern AsiaSouthern EuropeSpainSri LankaSt. Vincent and the GrenadinesSudanSwedenSwitzerlandSyriaTaiwanThailandTrinidad and TobagoTurkeyUgandaUkraineUruguayUzbekistanVenezuelaVietnamWest IndiesWestern AfricaWestern AsiaWestern EuropeYemenZaireZimbabweAzores
Single Father Poverty
Income
Poverty
Unemployment
Labor Participation
Family Structure
Vehicle Availability
Education Level
Disability

Single Father Poverty Comparison

Arabs

Immigrants from Burma/Myanmar

Poor
Fair
16.6%
SINGLE FATHER POVERTY
12.8/ 100
METRIC RATING
211th/ 347
METRIC RANK
16.5%
SINGLE FATHER POVERTY
28.0/ 100
METRIC RATING
190th/ 347
METRIC RANK

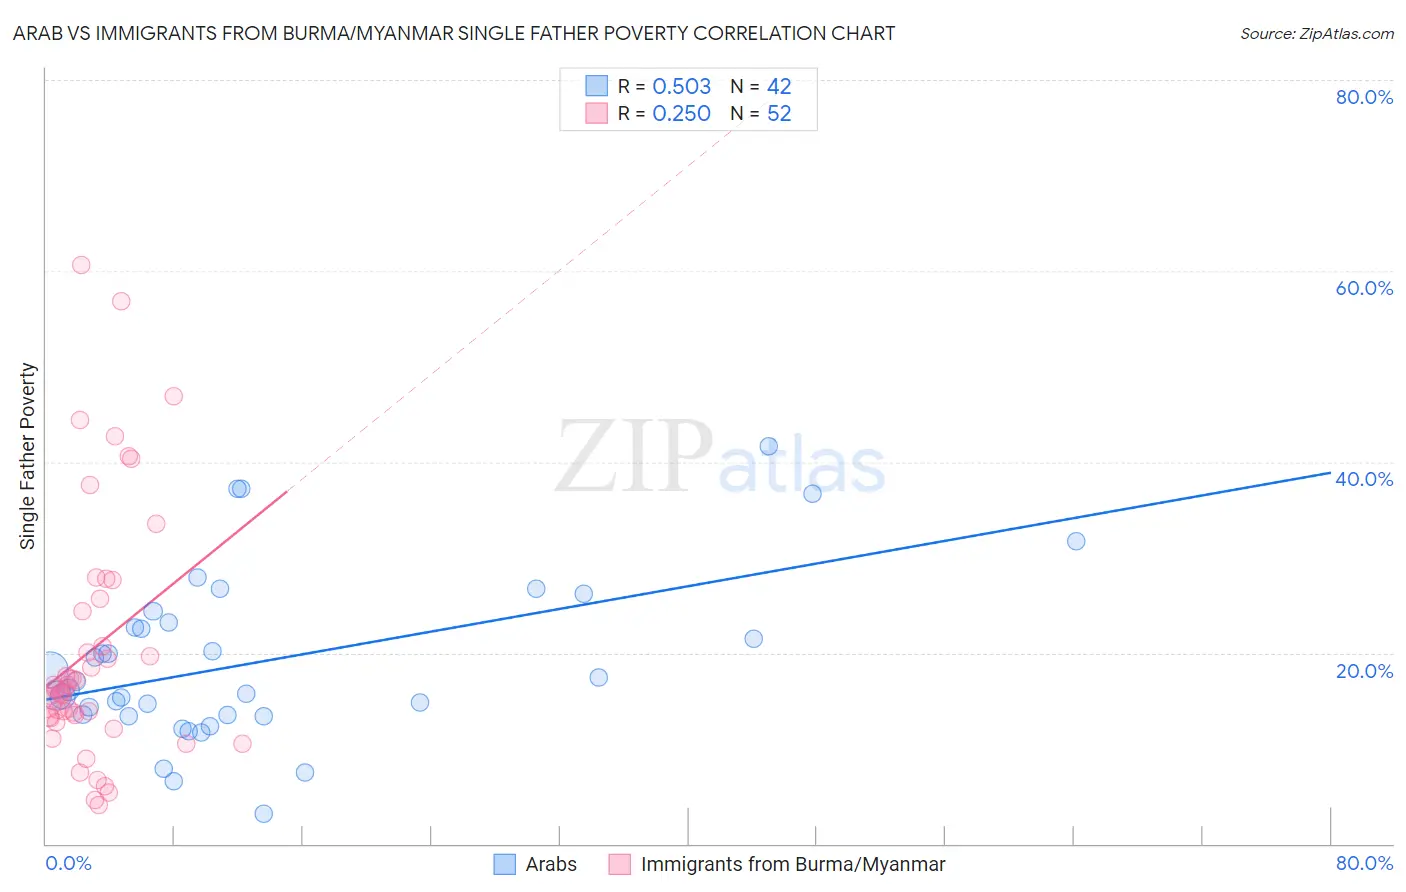
Arab vs Immigrants from Burma/Myanmar Single Father Poverty Correlation Chart

The statistical analysis conducted on geographies consisting of 369,349,186 people shows a substantial positive correlation between the proportion of Arabs and poverty level among single fathers in the United States with a correlation coefficient (R) of 0.503 and weighted average of 16.6%. Similarly, the statistical analysis conducted on geographies consisting of 151,197,682 people shows a weak positive correlation between the proportion of Immigrants from Burma/Myanmar and poverty level among single fathers in the United States with a correlation coefficient (R) of 0.250 and weighted average of 16.5%, a difference of 1.1%.
Arab vs Immigrants from Burma/Myanmar Single Father Poverty

Single Father Poverty Correlation Summary

MeasurementArabImmigrants from Burma/Myanmar
Minimum3.2%4.1%
Maximum41.6%60.6%
Range38.4%56.5%
Mean19.1%20.3%
Median16.6%16.1%
Interquartile 25% (IQ1)13.5%13.3%
Interquartile 75% (IQ3)23.1%25.0%
Interquartile Range (IQR)9.6%11.8%
Standard Deviation (Sample)8.7%13.0%
Standard Deviation (Population)8.6%12.9%

Similar Demographics by Single Father Poverty

Demographics Similar to Arabs by Single Father Poverty

In terms of single father poverty, the demographic groups most similar to Arabs are Guatemalan (16.6%, a difference of 0.0%), European (16.6%, a difference of 0.030%), Immigrants from Senegal (16.6%, a difference of 0.080%), New Zealander (16.6%, a difference of 0.080%), and Eastern European (16.6%, a difference of 0.080%).
DemographicsRating | RankSingle Father Poverty
Immigrants | Guatemala
14.8
/100
|
#204
Poor
16.6%
Venezuelans
14.3
/100
|
#205
Poor
16.6%
Immigrants | Senegal
13.7
/100
|
#206
Poor
16.6%
New Zealanders
13.7
/100
|
#207
Poor
16.6%
Eastern Europeans
13.7
/100
|
#208
Poor
16.6%
Europeans
13.2
/100
|
#209
Poor
16.6%
Guatemalans
12.9
/100
|
#210
Poor
16.6%
Arabs
12.8
/100
|
#211
Poor
16.6%
Immigrants | Southern Europe
11.2
/100
|
#212
Poor
16.7%
Ghanaians
11.0
/100
|
#213
Poor
16.7%
Spanish
10.7
/100
|
#214
Poor
16.7%
Immigrants | Scotland
9.6
/100
|
#215
Tragic
16.7%
Immigrants | England
9.5
/100
|
#216
Tragic
16.7%
Cheyenne
9.3
/100
|
#217
Tragic
16.7%
Immigrants | Uganda
8.6
/100
|
#218
Tragic
16.7%

Demographics Similar to Immigrants from Burma/Myanmar by Single Father Poverty

In terms of single father poverty, the demographic groups most similar to Immigrants from Burma/Myanmar are Latvian (16.5%, a difference of 0.050%), Immigrants from Guyana (16.5%, a difference of 0.050%), Russian (16.4%, a difference of 0.11%), Ukrainian (16.4%, a difference of 0.12%), and Immigrants from Venezuela (16.4%, a difference of 0.16%).
DemographicsRating | RankSingle Father Poverty
Aleuts
35.3
/100
|
#183
Fair
16.4%
Cambodians
34.6
/100
|
#184
Fair
16.4%
Panamanians
33.6
/100
|
#185
Fair
16.4%
Immigrants | Venezuela
31.0
/100
|
#186
Fair
16.4%
Ukrainians
30.4
/100
|
#187
Fair
16.4%
Russians
30.1
/100
|
#188
Fair
16.4%
Latvians
28.9
/100
|
#189
Fair
16.5%
Immigrants | Burma/Myanmar
28.0
/100
|
#190
Fair
16.5%
Immigrants | Guyana
27.1
/100
|
#191
Fair
16.5%
Immigrants | Switzerland
24.8
/100
|
#192
Fair
16.5%
Ecuadorians
24.5
/100
|
#193
Fair
16.5%
Cape Verdeans
24.4
/100
|
#194
Fair
16.5%
Immigrants | Barbados
24.3
/100
|
#195
Fair
16.5%
Immigrants | Canada
21.9
/100
|
#196
Fair
16.5%
Immigrants | Northern Europe
20.3
/100
|
#197
Fair
16.5%