Austrian vs Immigrants from Burma/Myanmar Single Father Poverty
COMPARE
Austrian
Immigrants from Burma/Myanmar
Single Father Poverty
Single Father Poverty Comparison
Austrians
Immigrants from Burma/Myanmar
17.1%
SINGLE FATHER POVERTY
1.1/ 100
METRIC RATING
250th/ 347
METRIC RANK
16.5%
SINGLE FATHER POVERTY
28.0/ 100
METRIC RATING
190th/ 347
METRIC RANK
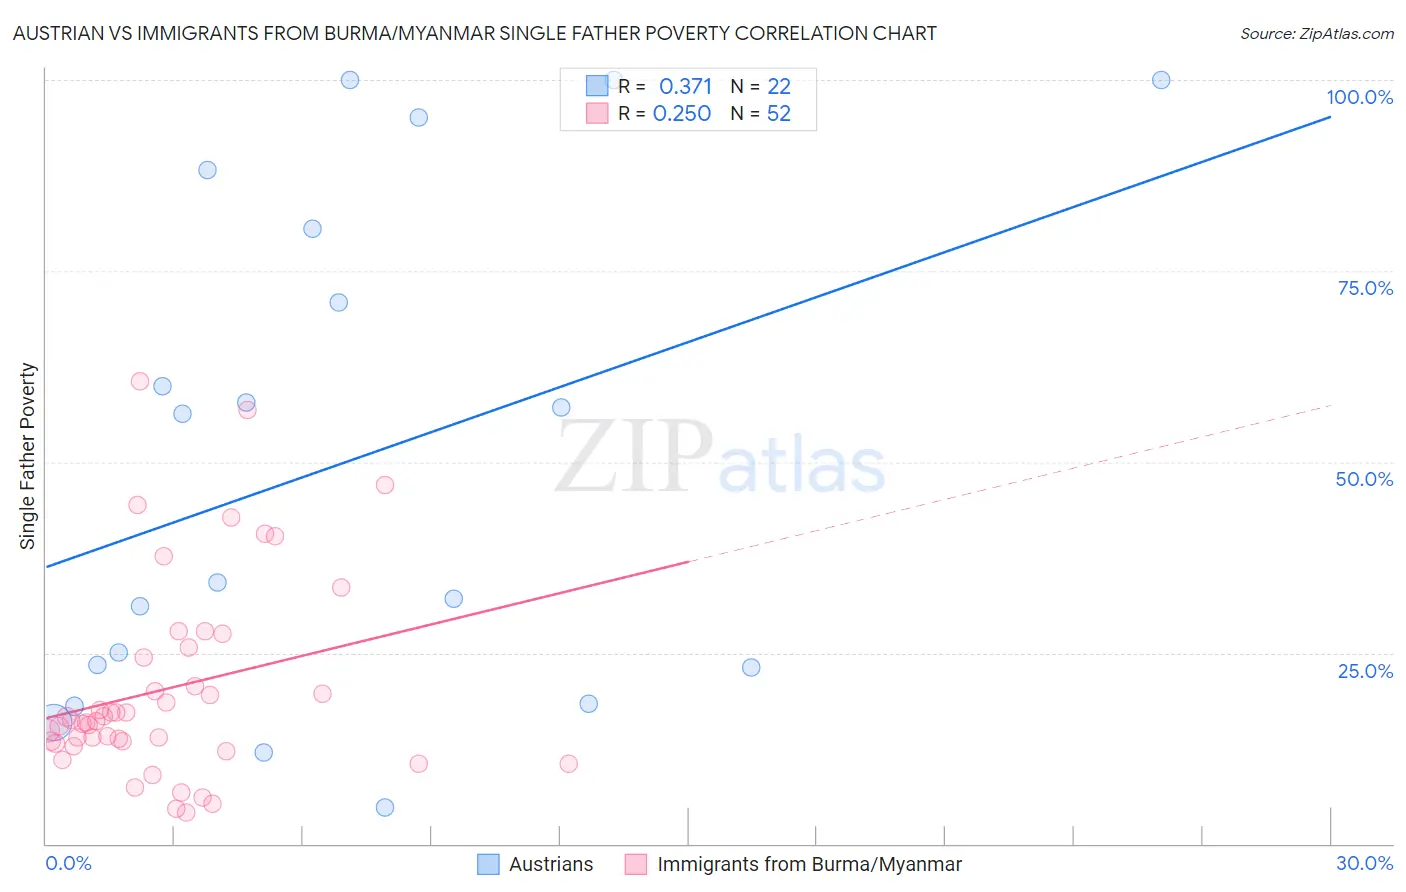
Austrian vs Immigrants from Burma/Myanmar Single Father Poverty Correlation Chart
The statistical analysis conducted on geographies consisting of 340,326,838 people shows a mild positive correlation between the proportion of Austrians and poverty level among single fathers in the United States with a correlation coefficient (R) of 0.371 and weighted average of 17.1%. Similarly, the statistical analysis conducted on geographies consisting of 151,197,682 people shows a weak positive correlation between the proportion of Immigrants from Burma/Myanmar and poverty level among single fathers in the United States with a correlation coefficient (R) of 0.250 and weighted average of 16.5%, a difference of 3.9%.
Single Father Poverty Correlation Summary
| Measurement | Austrian | Immigrants from Burma/Myanmar |
| Minimum | 4.8% | 4.1% |
| Maximum | 100.0% | 60.6% |
| Range | 95.2% | 56.5% |
| Mean | 50.2% | 20.3% |
| Median | 45.2% | 16.1% |
| Interquartile 25% (IQ1) | 23.1% | 13.3% |
| Interquartile 75% (IQ3) | 80.6% | 25.0% |
| Interquartile Range (IQR) | 57.5% | 11.8% |
| Standard Deviation (Sample) | 32.6% | 13.0% |
| Standard Deviation (Population) | 31.8% | 12.9% |
Similar Demographics by Single Father Poverty
Demographics Similar to Austrians by Single Father Poverty
In terms of single father poverty, the demographic groups most similar to Austrians are Luxembourger (17.1%, a difference of 0.010%), Croatian (17.1%, a difference of 0.11%), Cree (17.1%, a difference of 0.11%), Canadian (17.1%, a difference of 0.13%), and Czechoslovakian (17.1%, a difference of 0.17%).
| Demographics | Rating | Rank | Single Father Poverty |
| Immigrants | Cabo Verde | 1.6 /100 | #243 | Tragic 17.0% |
| Hondurans | 1.6 /100 | #244 | Tragic 17.0% |
| Trinidadians and Tobagonians | 1.5 /100 | #245 | Tragic 17.0% |
| Immigrants | Ireland | 1.4 /100 | #246 | Tragic 17.1% |
| Greeks | 1.3 /100 | #247 | Tragic 17.1% |
| Czechoslovakians | 1.3 /100 | #248 | Tragic 17.1% |
| Canadians | 1.3 /100 | #249 | Tragic 17.1% |
| Austrians | 1.1 /100 | #250 | Tragic 17.1% |
| Luxembourgers | 1.1 /100 | #251 | Tragic 17.1% |
| Croatians | 1.0 /100 | #252 | Tragic 17.1% |
| Cree | 1.0 /100 | #253 | Tragic 17.1% |
| Immigrants | Honduras | 0.9 /100 | #254 | Tragic 17.1% |
| Sierra Leoneans | 0.8 /100 | #255 | Tragic 17.2% |
| Immigrants | Haiti | 0.8 /100 | #256 | Tragic 17.2% |
| Immigrants | Albania | 0.7 /100 | #257 | Tragic 17.2% |
Demographics Similar to Immigrants from Burma/Myanmar by Single Father Poverty
In terms of single father poverty, the demographic groups most similar to Immigrants from Burma/Myanmar are Latvian (16.5%, a difference of 0.050%), Immigrants from Guyana (16.5%, a difference of 0.050%), Russian (16.4%, a difference of 0.11%), Ukrainian (16.4%, a difference of 0.12%), and Immigrants from Venezuela (16.4%, a difference of 0.16%).
| Demographics | Rating | Rank | Single Father Poverty |
| Aleuts | 35.3 /100 | #183 | Fair 16.4% |
| Cambodians | 34.6 /100 | #184 | Fair 16.4% |
| Panamanians | 33.6 /100 | #185 | Fair 16.4% |
| Immigrants | Venezuela | 31.0 /100 | #186 | Fair 16.4% |
| Ukrainians | 30.4 /100 | #187 | Fair 16.4% |
| Russians | 30.1 /100 | #188 | Fair 16.4% |
| Latvians | 28.9 /100 | #189 | Fair 16.5% |
| Immigrants | Burma/Myanmar | 28.0 /100 | #190 | Fair 16.5% |
| Immigrants | Guyana | 27.1 /100 | #191 | Fair 16.5% |
| Immigrants | Switzerland | 24.8 /100 | #192 | Fair 16.5% |
| Ecuadorians | 24.5 /100 | #193 | Fair 16.5% |
| Cape Verdeans | 24.4 /100 | #194 | Fair 16.5% |
| Immigrants | Barbados | 24.3 /100 | #195 | Fair 16.5% |
| Immigrants | Canada | 21.9 /100 | #196 | Fair 16.5% |
| Immigrants | Northern Europe | 20.3 /100 | #197 | Fair 16.5% |