Immigrants from Dominican Republic vs Immigrants from Burma/Myanmar Single Father Poverty
COMPARE
Immigrants from Dominican Republic
Immigrants from Burma/Myanmar
Single Father Poverty
Single Father Poverty Comparison
Immigrants from Dominican Republic
Immigrants from Burma/Myanmar
18.4%
SINGLE FATHER POVERTY
0.0/ 100
METRIC RATING
300th/ 347
METRIC RANK
16.5%
SINGLE FATHER POVERTY
28.0/ 100
METRIC RATING
190th/ 347
METRIC RANK
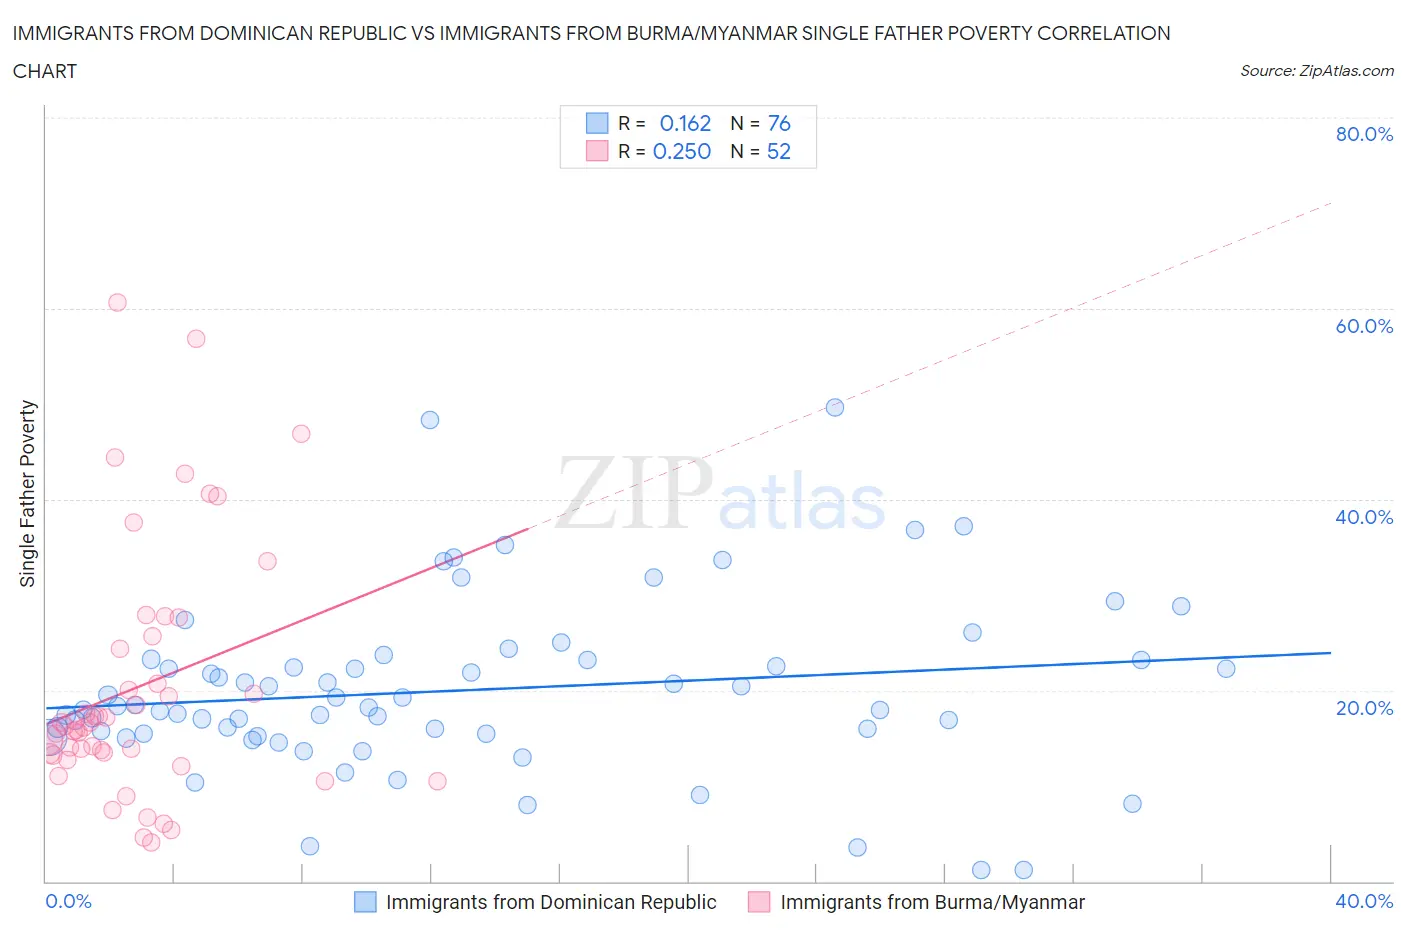
Immigrants from Dominican Republic vs Immigrants from Burma/Myanmar Single Father Poverty Correlation Chart
The statistical analysis conducted on geographies consisting of 226,907,636 people shows a poor positive correlation between the proportion of Immigrants from Dominican Republic and poverty level among single fathers in the United States with a correlation coefficient (R) of 0.162 and weighted average of 18.4%. Similarly, the statistical analysis conducted on geographies consisting of 151,197,682 people shows a weak positive correlation between the proportion of Immigrants from Burma/Myanmar and poverty level among single fathers in the United States with a correlation coefficient (R) of 0.250 and weighted average of 16.5%, a difference of 11.8%.
Single Father Poverty Correlation Summary
| Measurement | Immigrants from Dominican Republic | Immigrants from Burma/Myanmar |
| Minimum | 1.2% | 4.1% |
| Maximum | 49.7% | 60.6% |
| Range | 48.4% | 56.5% |
| Mean | 20.0% | 20.3% |
| Median | 18.2% | 16.1% |
| Interquartile 25% (IQ1) | 15.4% | 13.3% |
| Interquartile 75% (IQ3) | 23.2% | 25.0% |
| Interquartile Range (IQR) | 7.8% | 11.8% |
| Standard Deviation (Sample) | 9.0% | 13.0% |
| Standard Deviation (Population) | 9.0% | 12.9% |
Similar Demographics by Single Father Poverty
Demographics Similar to Immigrants from Dominican Republic by Single Father Poverty
In terms of single father poverty, the demographic groups most similar to Immigrants from Dominican Republic are Hungarian (18.5%, a difference of 0.22%), White/Caucasian (18.4%, a difference of 0.32%), Comanche (18.5%, a difference of 0.32%), Celtic (18.5%, a difference of 0.37%), and Ute (18.5%, a difference of 0.51%).
| Demographics | Rating | Rank | Single Father Poverty |
| Alaska Natives | 0.0 /100 | #293 | Tragic 18.1% |
| U.S. Virgin Islanders | 0.0 /100 | #294 | Tragic 18.1% |
| Yakama | 0.0 /100 | #295 | Tragic 18.1% |
| Seminole | 0.0 /100 | #296 | Tragic 18.1% |
| French | 0.0 /100 | #297 | Tragic 18.2% |
| Africans | 0.0 /100 | #298 | Tragic 18.3% |
| Whites/Caucasians | 0.0 /100 | #299 | Tragic 18.4% |
| Immigrants | Dominican Republic | 0.0 /100 | #300 | Tragic 18.4% |
| Hungarians | 0.0 /100 | #301 | Tragic 18.5% |
| Comanche | 0.0 /100 | #302 | Tragic 18.5% |
| Celtics | 0.0 /100 | #303 | Tragic 18.5% |
| Ute | 0.0 /100 | #304 | Tragic 18.5% |
| Blackfeet | 0.0 /100 | #305 | Tragic 18.5% |
| Scotch-Irish | 0.0 /100 | #306 | Tragic 18.6% |
| French Canadians | 0.0 /100 | #307 | Tragic 18.6% |
Demographics Similar to Immigrants from Burma/Myanmar by Single Father Poverty
In terms of single father poverty, the demographic groups most similar to Immigrants from Burma/Myanmar are Latvian (16.5%, a difference of 0.050%), Immigrants from Guyana (16.5%, a difference of 0.050%), Russian (16.4%, a difference of 0.11%), Ukrainian (16.4%, a difference of 0.12%), and Immigrants from Venezuela (16.4%, a difference of 0.16%).
| Demographics | Rating | Rank | Single Father Poverty |
| Aleuts | 35.3 /100 | #183 | Fair 16.4% |
| Cambodians | 34.6 /100 | #184 | Fair 16.4% |
| Panamanians | 33.6 /100 | #185 | Fair 16.4% |
| Immigrants | Venezuela | 31.0 /100 | #186 | Fair 16.4% |
| Ukrainians | 30.4 /100 | #187 | Fair 16.4% |
| Russians | 30.1 /100 | #188 | Fair 16.4% |
| Latvians | 28.9 /100 | #189 | Fair 16.5% |
| Immigrants | Burma/Myanmar | 28.0 /100 | #190 | Fair 16.5% |
| Immigrants | Guyana | 27.1 /100 | #191 | Fair 16.5% |
| Immigrants | Switzerland | 24.8 /100 | #192 | Fair 16.5% |
| Ecuadorians | 24.5 /100 | #193 | Fair 16.5% |
| Cape Verdeans | 24.4 /100 | #194 | Fair 16.5% |
| Immigrants | Barbados | 24.3 /100 | #195 | Fair 16.5% |
| Immigrants | Canada | 21.9 /100 | #196 | Fair 16.5% |
| Immigrants | Northern Europe | 20.3 /100 | #197 | Fair 16.5% |