Pima vs South American In Labor Force | Age 30-34
COMPARE
Pima
South American
In Labor Force | Age 30-34
In Labor Force | Age 30-34 Comparison
Pima
South Americans
79.0%
IN LABOR FORCE | AGE 30-34
0.0/ 100
METRIC RATING
338th/ 347
METRIC RANK
84.7%
IN LABOR FORCE | AGE 30-34
58.7/ 100
METRIC RATING
162nd/ 347
METRIC RANK
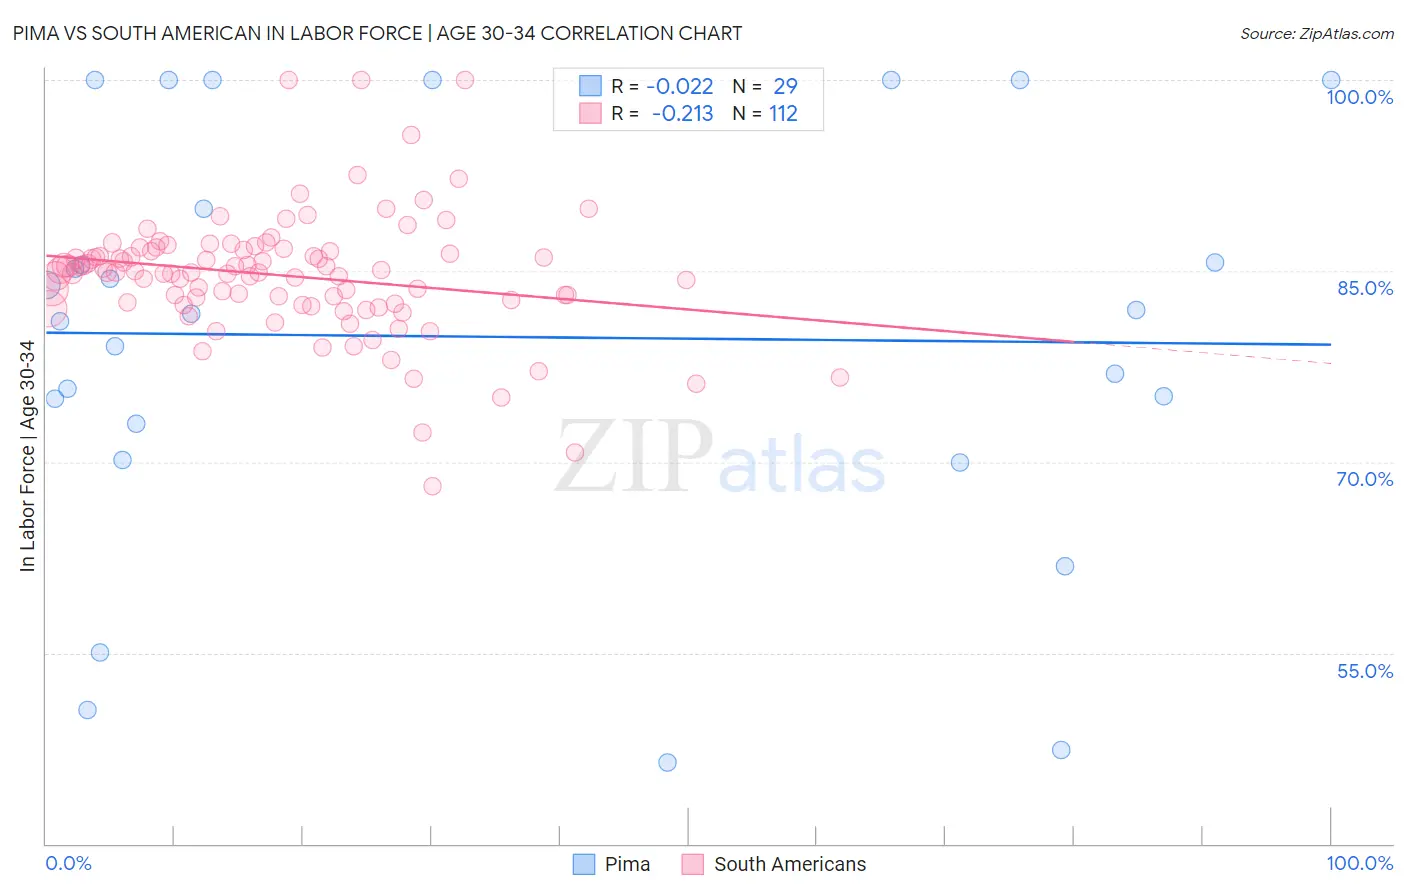
Pima vs South American In Labor Force | Age 30-34 Correlation Chart
The statistical analysis conducted on geographies consisting of 61,528,436 people shows no correlation between the proportion of Pima and labor force participation rate among population between the ages 30 and 34 in the United States with a correlation coefficient (R) of -0.022 and weighted average of 79.0%. Similarly, the statistical analysis conducted on geographies consisting of 493,657,533 people shows a weak negative correlation between the proportion of South Americans and labor force participation rate among population between the ages 30 and 34 in the United States with a correlation coefficient (R) of -0.213 and weighted average of 84.7%, a difference of 7.2%.
In Labor Force | Age 30-34 Correlation Summary
| Measurement | Pima | South American |
| Minimum | 46.4% | 68.1% |
| Maximum | 100.0% | 100.0% |
| Range | 53.6% | 31.9% |
| Mean | 79.8% | 84.6% |
| Median | 81.6% | 84.9% |
| Interquartile 25% (IQ1) | 71.6% | 82.5% |
| Interquartile 75% (IQ3) | 95.0% | 86.6% |
| Interquartile Range (IQR) | 23.4% | 4.1% |
| Standard Deviation (Sample) | 16.2% | 4.9% |
| Standard Deviation (Population) | 15.9% | 4.8% |
Similar Demographics by In Labor Force | Age 30-34
Demographics Similar to Pima by In Labor Force | Age 30-34
In terms of in labor force | age 30-34, the demographic groups most similar to Pima are Apache (79.0%, a difference of 0.030%), Yakama (79.1%, a difference of 0.12%), Ute (78.9%, a difference of 0.13%), Native/Alaskan (79.2%, a difference of 0.16%), and Marshallese (79.2%, a difference of 0.24%).
| Demographics | Rating | Rank | In Labor Force | Age 30-34 |
| Houma | 0.0 /100 | #331 | Tragic 79.9% |
| Kiowa | 0.0 /100 | #332 | Tragic 79.8% |
| Inupiat | 0.0 /100 | #333 | Tragic 79.7% |
| Hopi | 0.0 /100 | #334 | Tragic 79.3% |
| Marshallese | 0.0 /100 | #335 | Tragic 79.2% |
| Natives/Alaskans | 0.0 /100 | #336 | Tragic 79.2% |
| Yakama | 0.0 /100 | #337 | Tragic 79.1% |
| Pima | 0.0 /100 | #338 | Tragic 79.0% |
| Apache | 0.0 /100 | #339 | Tragic 79.0% |
| Ute | 0.0 /100 | #340 | Tragic 78.9% |
| Immigrants | Yemen | 0.0 /100 | #341 | Tragic 78.2% |
| Tohono O'odham | 0.0 /100 | #342 | Tragic 77.7% |
| Lumbee | 0.0 /100 | #343 | Tragic 77.3% |
| Yuman | 0.0 /100 | #344 | Tragic 77.1% |
| Yup'ik | 0.0 /100 | #345 | Tragic 76.4% |
Demographics Similar to South Americans by In Labor Force | Age 30-34
In terms of in labor force | age 30-34, the demographic groups most similar to South Americans are Immigrants from Cambodia (84.7%, a difference of 0.010%), Immigrants from Uruguay (84.7%, a difference of 0.010%), Icelander (84.7%, a difference of 0.010%), Immigrants from Western Europe (84.7%, a difference of 0.010%), and Pakistani (84.7%, a difference of 0.020%).
| Demographics | Rating | Rank | In Labor Force | Age 30-34 |
| Immigrants | Sudan | 69.5 /100 | #155 | Good 84.8% |
| French Canadians | 67.3 /100 | #156 | Good 84.8% |
| Peruvians | 65.9 /100 | #157 | Good 84.8% |
| Immigrants | Armenia | 64.7 /100 | #158 | Good 84.8% |
| Czechoslovakians | 63.0 /100 | #159 | Good 84.8% |
| Pakistanis | 60.8 /100 | #160 | Good 84.7% |
| Immigrants | Cambodia | 60.7 /100 | #161 | Good 84.7% |
| South Americans | 58.7 /100 | #162 | Average 84.7% |
| Immigrants | Uruguay | 57.4 /100 | #163 | Average 84.7% |
| Icelanders | 56.8 /100 | #164 | Average 84.7% |
| Immigrants | Western Europe | 56.7 /100 | #165 | Average 84.7% |
| Afghans | 55.2 /100 | #166 | Average 84.7% |
| Immigrants | South Eastern Asia | 54.2 /100 | #167 | Average 84.7% |
| Immigrants | Peru | 52.4 /100 | #168 | Average 84.7% |
| South American Indians | 52.1 /100 | #169 | Average 84.7% |