Pima vs South American Disability Age 35 to 64
COMPARE
Pima
South American
Disability Age 35 to 64
Disability Age 35 to 64 Comparison
Pima
South Americans
16.1%
DISABILITY AGE 35 TO 64
0.0/ 100
METRIC RATING
339th/ 347
METRIC RANK
9.9%
DISABILITY AGE 35 TO 64
99.8/ 100
METRIC RATING
56th/ 347
METRIC RANK
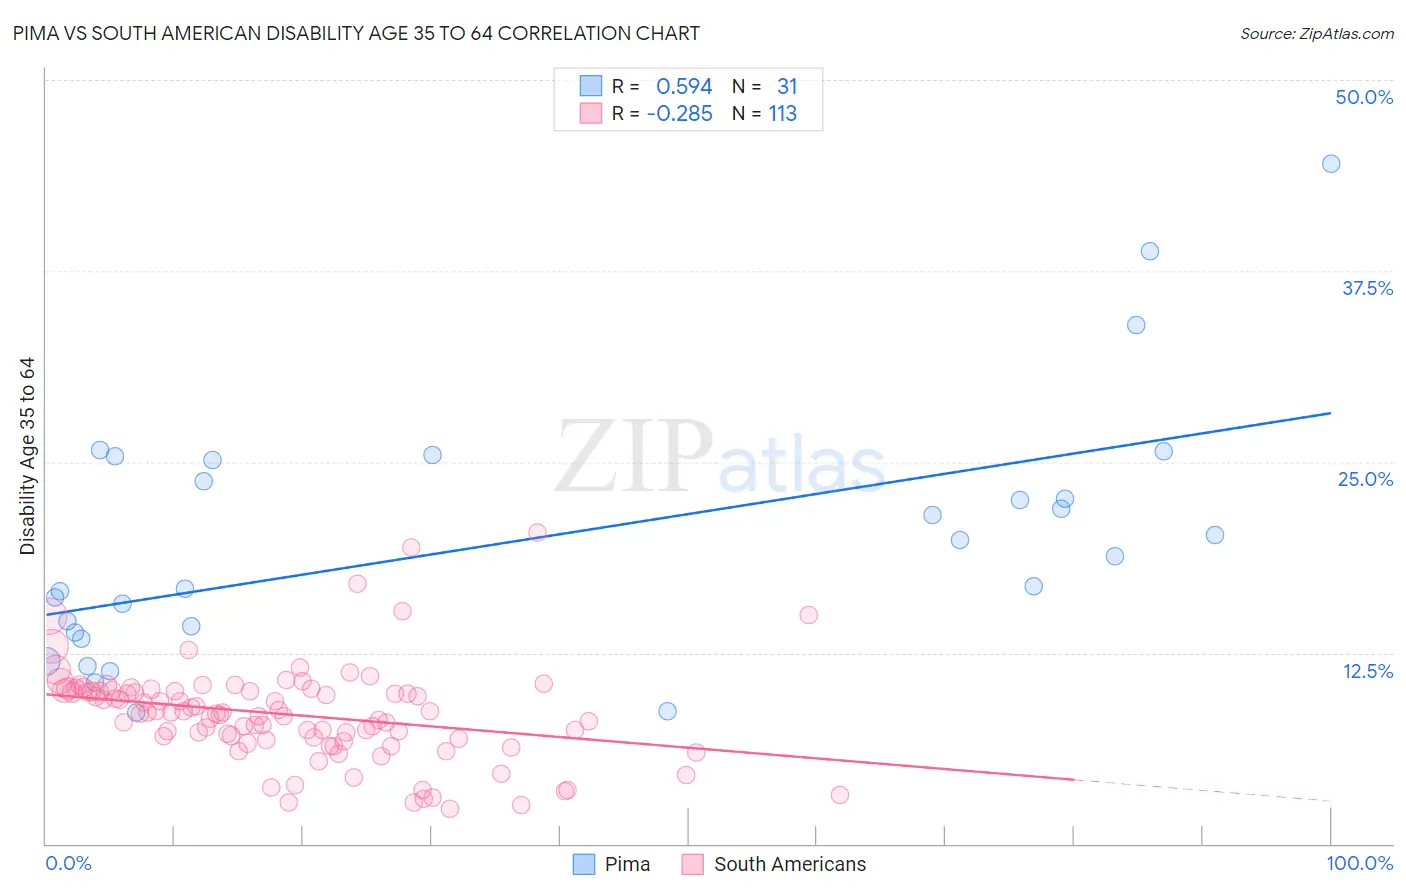
Pima vs South American Disability Age 35 to 64 Correlation Chart
The statistical analysis conducted on geographies consisting of 61,540,994 people shows a substantial positive correlation between the proportion of Pima and percentage of population with a disability between the ages 34 and 64 in the United States with a correlation coefficient (R) of 0.594 and weighted average of 16.1%. Similarly, the statistical analysis conducted on geographies consisting of 493,521,440 people shows a weak negative correlation between the proportion of South Americans and percentage of population with a disability between the ages 34 and 64 in the United States with a correlation coefficient (R) of -0.285 and weighted average of 9.9%, a difference of 63.4%.
Disability Age 35 to 64 Correlation Summary
| Measurement | Pima | South American |
| Minimum | 8.6% | 2.3% |
| Maximum | 44.5% | 20.4% |
| Range | 35.9% | 18.1% |
| Mean | 19.9% | 8.5% |
| Median | 18.9% | 8.6% |
| Interquartile 25% (IQ1) | 13.8% | 6.8% |
| Interquartile 75% (IQ3) | 25.1% | 10.0% |
| Interquartile Range (IQR) | 11.3% | 3.2% |
| Standard Deviation (Sample) | 8.4% | 3.1% |
| Standard Deviation (Population) | 8.2% | 3.1% |
Similar Demographics by Disability Age 35 to 64
Demographics Similar to Pima by Disability Age 35 to 64
In terms of disability age 35 to 64, the demographic groups most similar to Pima are Chickasaw (16.1%, a difference of 0.20%), Puerto Rican (15.9%, a difference of 1.2%), Menominee (15.9%, a difference of 1.6%), Choctaw (16.4%, a difference of 1.7%), and Seminole (15.9%, a difference of 1.8%).
| Demographics | Rating | Rank | Disability Age 35 to 64 |
| Alaskan Athabascans | 0.0 /100 | #332 | Tragic 15.7% |
| Yuman | 0.0 /100 | #333 | Tragic 15.8% |
| Colville | 0.0 /100 | #334 | Tragic 15.8% |
| Seminole | 0.0 /100 | #335 | Tragic 15.9% |
| Menominee | 0.0 /100 | #336 | Tragic 15.9% |
| Puerto Ricans | 0.0 /100 | #337 | Tragic 15.9% |
| Chickasaw | 0.0 /100 | #338 | Tragic 16.1% |
| Pima | 0.0 /100 | #339 | Tragic 16.1% |
| Choctaw | 0.0 /100 | #340 | Tragic 16.4% |
| Tsimshian | 0.0 /100 | #341 | Tragic 16.7% |
| Tohono O'odham | 0.0 /100 | #342 | Tragic 16.7% |
| Creek | 0.0 /100 | #343 | Tragic 16.9% |
| Yup'ik | 0.0 /100 | #344 | Tragic 16.9% |
| Kiowa | 0.0 /100 | #345 | Tragic 17.4% |
| Lumbee | 0.0 /100 | #346 | Tragic 17.6% |
Demographics Similar to South Americans by Disability Age 35 to 64
In terms of disability age 35 to 64, the demographic groups most similar to South Americans are Colombian (9.9%, a difference of 0.010%), Armenian (9.9%, a difference of 0.12%), Peruvian (9.9%, a difference of 0.22%), Immigrants from Russia (9.8%, a difference of 0.29%), and Taiwanese (9.8%, a difference of 0.32%).
| Demographics | Rating | Rank | Disability Age 35 to 64 |
| Immigrants | Greece | 99.8 /100 | #49 | Exceptional 9.8% |
| Paraguayans | 99.8 /100 | #50 | Exceptional 9.8% |
| Bhutanese | 99.8 /100 | #51 | Exceptional 9.8% |
| Immigrants | Bulgaria | 99.8 /100 | #52 | Exceptional 9.8% |
| Taiwanese | 99.8 /100 | #53 | Exceptional 9.8% |
| Immigrants | Russia | 99.8 /100 | #54 | Exceptional 9.8% |
| Peruvians | 99.8 /100 | #55 | Exceptional 9.9% |
| South Americans | 99.8 /100 | #56 | Exceptional 9.9% |
| Colombians | 99.8 /100 | #57 | Exceptional 9.9% |
| Armenians | 99.8 /100 | #58 | Exceptional 9.9% |
| Immigrants | Sweden | 99.7 /100 | #59 | Exceptional 9.9% |
| Immigrants | South America | 99.7 /100 | #60 | Exceptional 9.9% |
| Immigrants | Spain | 99.7 /100 | #61 | Exceptional 10.0% |
| Eastern Europeans | 99.7 /100 | #62 | Exceptional 10.0% |
| Immigrants | Czechoslovakia | 99.7 /100 | #63 | Exceptional 10.0% |