Ukrainian vs Russian Single Mother Poverty
COMPARE
Ukrainian
Russian
Single Mother Poverty
Single Mother Poverty Comparison
Ukrainians
Russians
28.0%
SINGLE MOTHER POVERTY
96.4/ 100
METRIC RATING
106th/ 347
METRIC RANK
27.3%
SINGLE MOTHER POVERTY
99.5/ 100
METRIC RATING
64th/ 347
METRIC RANK
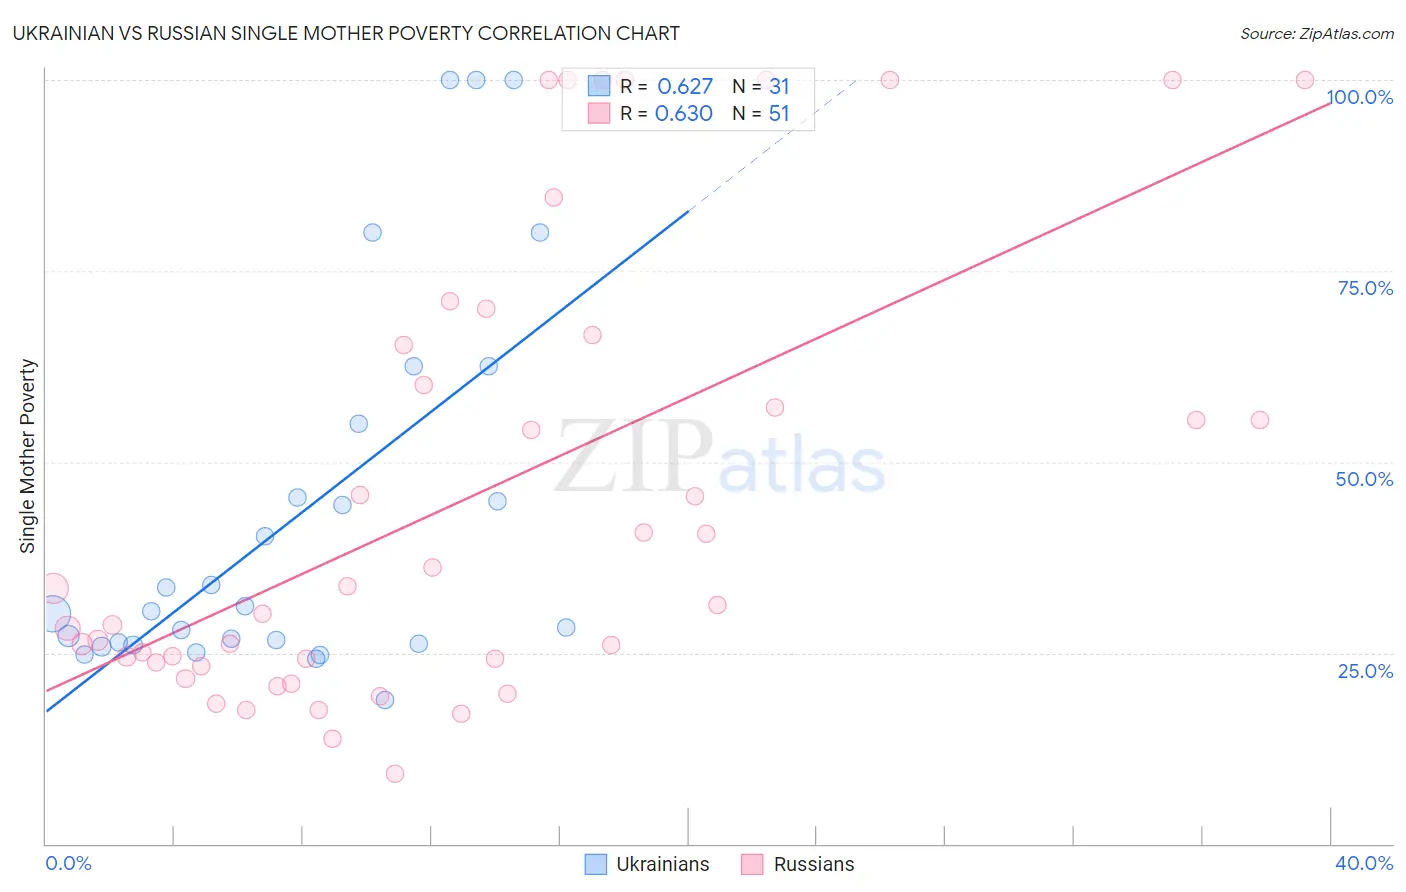
Ukrainian vs Russian Single Mother Poverty Correlation Chart
The statistical analysis conducted on geographies consisting of 432,495,804 people shows a significant positive correlation between the proportion of Ukrainians and poverty level among single mothers in the United States with a correlation coefficient (R) of 0.627 and weighted average of 28.0%. Similarly, the statistical analysis conducted on geographies consisting of 491,168,299 people shows a significant positive correlation between the proportion of Russians and poverty level among single mothers in the United States with a correlation coefficient (R) of 0.630 and weighted average of 27.3%, a difference of 2.6%.
Single Mother Poverty Correlation Summary
| Measurement | Ukrainian | Russian |
| Minimum | 18.8% | 9.2% |
| Maximum | 100.0% | 100.0% |
| Range | 81.2% | 90.8% |
| Mean | 43.0% | 45.2% |
| Median | 30.4% | 31.2% |
| Interquartile 25% (IQ1) | 26.3% | 23.7% |
| Interquartile 75% (IQ3) | 55.0% | 65.4% |
| Interquartile Range (IQR) | 28.7% | 41.7% |
| Standard Deviation (Sample) | 24.7% | 29.2% |
| Standard Deviation (Population) | 24.3% | 28.9% |
Similar Demographics by Single Mother Poverty
Demographics Similar to Ukrainians by Single Mother Poverty
In terms of single mother poverty, the demographic groups most similar to Ukrainians are Israeli (28.0%, a difference of 0.040%), Italian (28.0%, a difference of 0.070%), Immigrants from Northern Africa (28.0%, a difference of 0.090%), Immigrants from Croatia (28.0%, a difference of 0.10%), and Pakistani (28.0%, a difference of 0.20%).
| Demographics | Rating | Rank | Single Mother Poverty |
| Immigrants | Netherlands | 97.2 /100 | #99 | Exceptional 27.9% |
| Zimbabweans | 97.1 /100 | #100 | Exceptional 27.9% |
| Pakistanis | 96.9 /100 | #101 | Exceptional 28.0% |
| Immigrants | Croatia | 96.7 /100 | #102 | Exceptional 28.0% |
| Immigrants | Northern Africa | 96.6 /100 | #103 | Exceptional 28.0% |
| Italians | 96.6 /100 | #104 | Exceptional 28.0% |
| Israelis | 96.5 /100 | #105 | Exceptional 28.0% |
| Ukrainians | 96.4 /100 | #106 | Exceptional 28.0% |
| Immigrants | Venezuela | 95.8 /100 | #107 | Exceptional 28.1% |
| Immigrants | Zimbabwe | 95.5 /100 | #108 | Exceptional 28.1% |
| Immigrants | Armenia | 95.2 /100 | #109 | Exceptional 28.1% |
| Croatians | 94.8 /100 | #110 | Exceptional 28.2% |
| Venezuelans | 94.5 /100 | #111 | Exceptional 28.2% |
| Immigrants | Kazakhstan | 94.5 /100 | #112 | Exceptional 28.2% |
| Immigrants | South Africa | 93.2 /100 | #113 | Exceptional 28.3% |
Demographics Similar to Russians by Single Mother Poverty
In terms of single mother poverty, the demographic groups most similar to Russians are Immigrants from Northern Europe (27.3%, a difference of 0.030%), Immigrants from Malaysia (27.3%, a difference of 0.080%), Immigrants from Turkey (27.3%, a difference of 0.080%), Soviet Union (27.3%, a difference of 0.12%), and Immigrants from Australia (27.3%, a difference of 0.14%).
| Demographics | Rating | Rank | Single Mother Poverty |
| Palestinians | 99.7 /100 | #57 | Exceptional 27.2% |
| Argentineans | 99.6 /100 | #58 | Exceptional 27.2% |
| Paraguayans | 99.6 /100 | #59 | Exceptional 27.2% |
| Eastern Europeans | 99.6 /100 | #60 | Exceptional 27.2% |
| Immigrants | Eastern Europe | 99.6 /100 | #61 | Exceptional 27.2% |
| Immigrants | Malaysia | 99.5 /100 | #62 | Exceptional 27.3% |
| Immigrants | Northern Europe | 99.5 /100 | #63 | Exceptional 27.3% |
| Russians | 99.5 /100 | #64 | Exceptional 27.3% |
| Immigrants | Turkey | 99.5 /100 | #65 | Exceptional 27.3% |
| Soviet Union | 99.5 /100 | #66 | Exceptional 27.3% |
| Immigrants | Australia | 99.5 /100 | #67 | Exceptional 27.3% |
| Immigrants | Czechoslovakia | 99.5 /100 | #68 | Exceptional 27.4% |
| Lithuanians | 99.4 /100 | #69 | Exceptional 27.4% |
| Immigrants | Belarus | 99.4 /100 | #70 | Exceptional 27.4% |
| Macedonians | 99.4 /100 | #71 | Exceptional 27.4% |