Pima vs Cypriot Single Mother Poverty
COMPARE
Pima
Cypriot
Single Mother Poverty
Single Mother Poverty Comparison
Pima
Cypriots
38.6%
SINGLE MOTHER POVERTY
0.0/ 100
METRIC RATING
338th/ 347
METRIC RANK
28.3%
SINGLE MOTHER POVERTY
92.3/ 100
METRIC RATING
120th/ 347
METRIC RANK
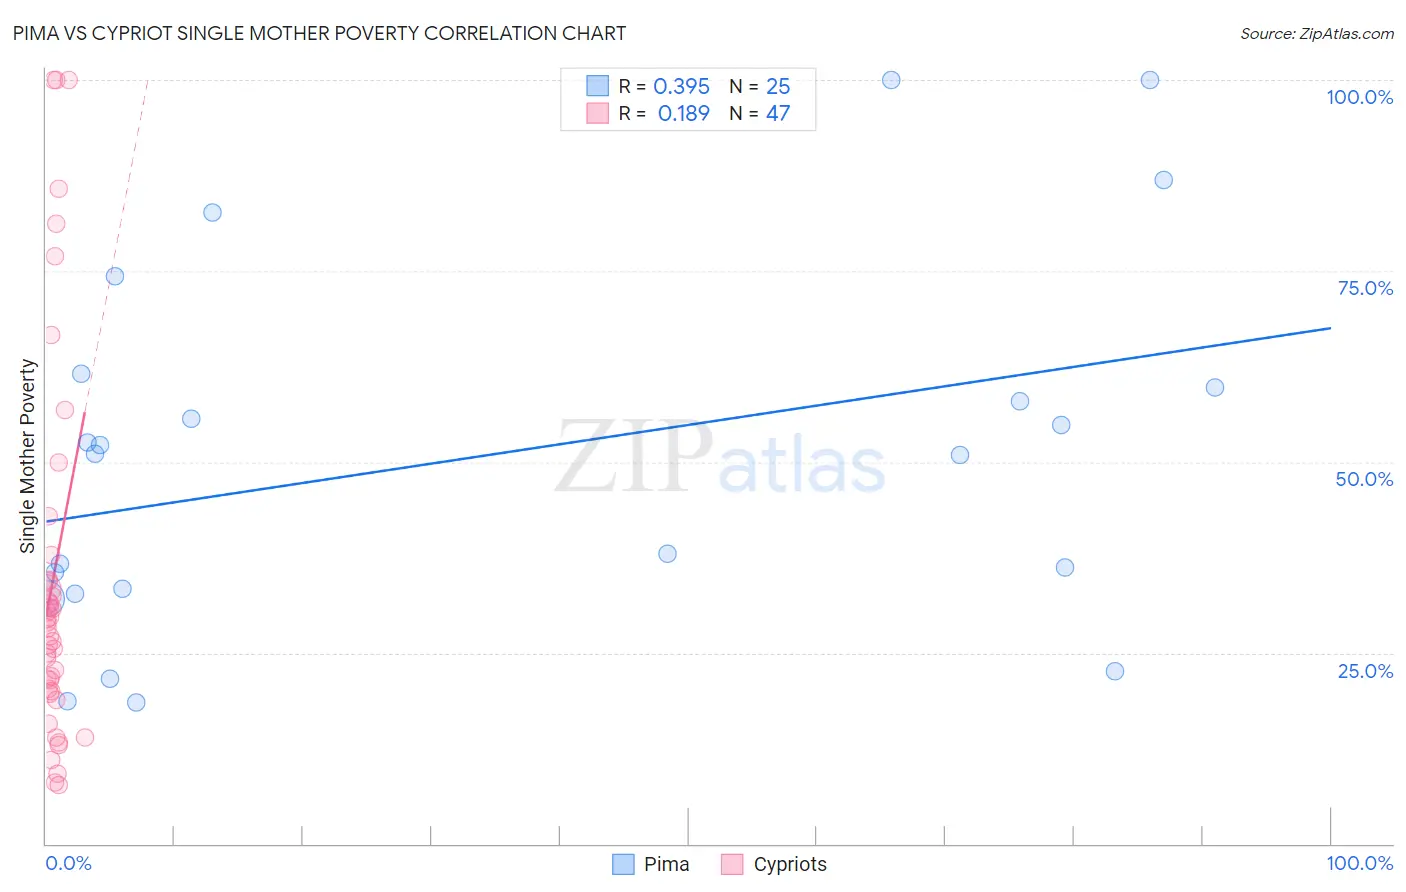
Pima vs Cypriot Single Mother Poverty Correlation Chart
The statistical analysis conducted on geographies consisting of 61,247,858 people shows a mild positive correlation between the proportion of Pima and poverty level among single mothers in the United States with a correlation coefficient (R) of 0.395 and weighted average of 38.6%. Similarly, the statistical analysis conducted on geographies consisting of 61,106,831 people shows a poor positive correlation between the proportion of Cypriots and poverty level among single mothers in the United States with a correlation coefficient (R) of 0.189 and weighted average of 28.3%, a difference of 36.4%.
Single Mother Poverty Correlation Summary
| Measurement | Pima | Cypriot |
| Minimum | 18.5% | 7.7% |
| Maximum | 100.0% | 100.0% |
| Range | 81.5% | 92.3% |
| Mean | 50.6% | 34.7% |
| Median | 51.0% | 28.2% |
| Interquartile 25% (IQ1) | 33.1% | 20.0% |
| Interquartile 75% (IQ3) | 60.6% | 34.6% |
| Interquartile Range (IQR) | 27.5% | 14.7% |
| Standard Deviation (Sample) | 23.7% | 24.8% |
| Standard Deviation (Population) | 23.3% | 24.5% |
Similar Demographics by Single Mother Poverty
Demographics Similar to Pima by Single Mother Poverty
In terms of single mother poverty, the demographic groups most similar to Pima are Crow (38.6%, a difference of 0.090%), Immigrants from Yemen (38.5%, a difference of 0.21%), Cheyenne (38.5%, a difference of 0.25%), Sioux (38.8%, a difference of 0.49%), and Colville (39.3%, a difference of 1.8%).
| Demographics | Rating | Rank | Single Mother Poverty |
| Creek | 0.0 /100 | #331 | Tragic 36.7% |
| Dutch West Indians | 0.0 /100 | #332 | Tragic 36.8% |
| Menominee | 0.0 /100 | #333 | Tragic 37.1% |
| Pueblo | 0.0 /100 | #334 | Tragic 37.2% |
| Yuman | 0.0 /100 | #335 | Tragic 37.8% |
| Cheyenne | 0.0 /100 | #336 | Tragic 38.5% |
| Immigrants | Yemen | 0.0 /100 | #337 | Tragic 38.5% |
| Pima | 0.0 /100 | #338 | Tragic 38.6% |
| Crow | 0.0 /100 | #339 | Tragic 38.6% |
| Sioux | 0.0 /100 | #340 | Tragic 38.8% |
| Colville | 0.0 /100 | #341 | Tragic 39.3% |
| Navajo | 0.0 /100 | #342 | Tragic 40.2% |
| Cajuns | 0.0 /100 | #343 | Tragic 40.3% |
| Tohono O'odham | 0.0 /100 | #344 | Tragic 43.0% |
| Lumbee | 0.0 /100 | #345 | Tragic 43.2% |
Demographics Similar to Cypriots by Single Mother Poverty
In terms of single mother poverty, the demographic groups most similar to Cypriots are Immigrants from Syria (28.3%, a difference of 0.020%), Brazilian (28.3%, a difference of 0.030%), Australian (28.3%, a difference of 0.040%), Immigrants from Afghanistan (28.3%, a difference of 0.040%), and Immigrants from Uganda (28.3%, a difference of 0.050%).
| Demographics | Rating | Rank | Single Mother Poverty |
| Immigrants | South Africa | 93.2 /100 | #113 | Exceptional 28.3% |
| Immigrants | Western Asia | 92.7 /100 | #114 | Exceptional 28.3% |
| Immigrants | Kuwait | 92.7 /100 | #115 | Exceptional 28.3% |
| Immigrants | Uganda | 92.5 /100 | #116 | Exceptional 28.3% |
| Australians | 92.5 /100 | #117 | Exceptional 28.3% |
| Brazilians | 92.4 /100 | #118 | Exceptional 28.3% |
| Immigrants | Syria | 92.4 /100 | #119 | Exceptional 28.3% |
| Cypriots | 92.3 /100 | #120 | Exceptional 28.3% |
| Immigrants | Afghanistan | 92.1 /100 | #121 | Exceptional 28.3% |
| Colombians | 91.8 /100 | #122 | Exceptional 28.3% |
| Uruguayans | 91.7 /100 | #123 | Exceptional 28.3% |
| Immigrants | Switzerland | 91.7 /100 | #124 | Exceptional 28.3% |
| Kenyans | 90.9 /100 | #125 | Exceptional 28.4% |
| Immigrants | Chile | 90.8 /100 | #126 | Exceptional 28.4% |
| Poles | 90.8 /100 | #127 | Exceptional 28.4% |