Ethiopian vs Russian Single Mother Poverty
COMPARE
Ethiopian
Russian
Single Mother Poverty
Single Mother Poverty Comparison
Ethiopians
Russians
27.7%
SINGLE MOTHER POVERTY
98.4/ 100
METRIC RATING
88th/ 347
METRIC RANK
27.3%
SINGLE MOTHER POVERTY
99.5/ 100
METRIC RATING
64th/ 347
METRIC RANK
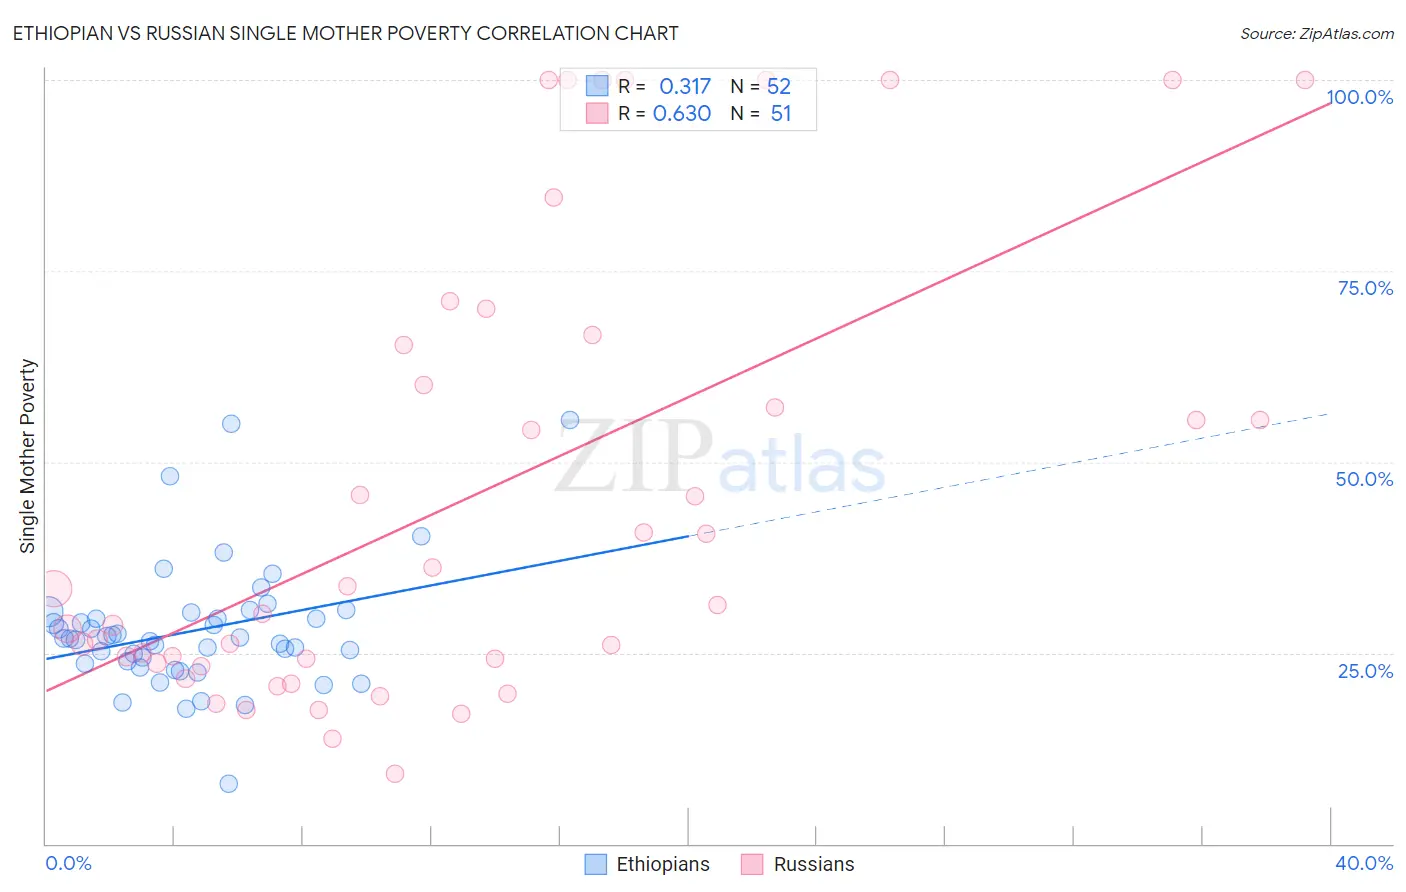
Ethiopian vs Russian Single Mother Poverty Correlation Chart
The statistical analysis conducted on geographies consisting of 220,975,245 people shows a mild positive correlation between the proportion of Ethiopians and poverty level among single mothers in the United States with a correlation coefficient (R) of 0.317 and weighted average of 27.7%. Similarly, the statistical analysis conducted on geographies consisting of 491,168,299 people shows a significant positive correlation between the proportion of Russians and poverty level among single mothers in the United States with a correlation coefficient (R) of 0.630 and weighted average of 27.3%, a difference of 1.5%.
Single Mother Poverty Correlation Summary
| Measurement | Ethiopian | Russian |
| Minimum | 7.9% | 9.2% |
| Maximum | 55.4% | 100.0% |
| Range | 47.5% | 90.8% |
| Mean | 27.9% | 45.2% |
| Median | 26.9% | 31.2% |
| Interquartile 25% (IQ1) | 23.7% | 23.7% |
| Interquartile 75% (IQ3) | 29.9% | 65.4% |
| Interquartile Range (IQR) | 6.1% | 41.7% |
| Standard Deviation (Sample) | 8.3% | 29.2% |
| Standard Deviation (Population) | 8.2% | 28.9% |
Similar Demographics by Single Mother Poverty
Demographics Similar to Ethiopians by Single Mother Poverty
In terms of single mother poverty, the demographic groups most similar to Ethiopians are Afghan (27.7%, a difference of 0.020%), Immigrants from Ethiopia (27.7%, a difference of 0.020%), Immigrants from Ukraine (27.7%, a difference of 0.12%), Immigrants from France (27.8%, a difference of 0.19%), and Mongolian (27.7%, a difference of 0.21%).
| Demographics | Rating | Rank | Single Mother Poverty |
| Immigrants | Scotland | 98.9 /100 | #81 | Exceptional 27.6% |
| Immigrants | Cameroon | 98.8 /100 | #82 | Exceptional 27.6% |
| Greeks | 98.7 /100 | #83 | Exceptional 27.7% |
| Immigrants | Latvia | 98.7 /100 | #84 | Exceptional 27.7% |
| Mongolians | 98.7 /100 | #85 | Exceptional 27.7% |
| Immigrants | Ukraine | 98.6 /100 | #86 | Exceptional 27.7% |
| Afghans | 98.5 /100 | #87 | Exceptional 27.7% |
| Ethiopians | 98.4 /100 | #88 | Exceptional 27.7% |
| Immigrants | Ethiopia | 98.4 /100 | #89 | Exceptional 27.7% |
| Immigrants | France | 98.2 /100 | #90 | Exceptional 27.8% |
| Immigrants | Albania | 98.0 /100 | #91 | Exceptional 27.8% |
| Estonians | 97.9 /100 | #92 | Exceptional 27.8% |
| Romanians | 97.8 /100 | #93 | Exceptional 27.8% |
| Albanians | 97.6 /100 | #94 | Exceptional 27.9% |
| Chileans | 97.5 /100 | #95 | Exceptional 27.9% |
Demographics Similar to Russians by Single Mother Poverty
In terms of single mother poverty, the demographic groups most similar to Russians are Immigrants from Northern Europe (27.3%, a difference of 0.030%), Immigrants from Malaysia (27.3%, a difference of 0.080%), Immigrants from Turkey (27.3%, a difference of 0.080%), Soviet Union (27.3%, a difference of 0.12%), and Immigrants from Australia (27.3%, a difference of 0.14%).
| Demographics | Rating | Rank | Single Mother Poverty |
| Palestinians | 99.7 /100 | #57 | Exceptional 27.2% |
| Argentineans | 99.6 /100 | #58 | Exceptional 27.2% |
| Paraguayans | 99.6 /100 | #59 | Exceptional 27.2% |
| Eastern Europeans | 99.6 /100 | #60 | Exceptional 27.2% |
| Immigrants | Eastern Europe | 99.6 /100 | #61 | Exceptional 27.2% |
| Immigrants | Malaysia | 99.5 /100 | #62 | Exceptional 27.3% |
| Immigrants | Northern Europe | 99.5 /100 | #63 | Exceptional 27.3% |
| Russians | 99.5 /100 | #64 | Exceptional 27.3% |
| Immigrants | Turkey | 99.5 /100 | #65 | Exceptional 27.3% |
| Soviet Union | 99.5 /100 | #66 | Exceptional 27.3% |
| Immigrants | Australia | 99.5 /100 | #67 | Exceptional 27.3% |
| Immigrants | Czechoslovakia | 99.5 /100 | #68 | Exceptional 27.4% |
| Lithuanians | 99.4 /100 | #69 | Exceptional 27.4% |
| Immigrants | Belarus | 99.4 /100 | #70 | Exceptional 27.4% |
| Macedonians | 99.4 /100 | #71 | Exceptional 27.4% |