Pima vs Immigrants Single Mother Poverty
COMPARE
Pima
Immigrants
Single Mother Poverty
Single Mother Poverty Comparison
Pima
Immigrants
38.6%
SINGLE MOTHER POVERTY
0.0/ 100
METRIC RATING
338th/ 347
METRIC RANK
29.7%
SINGLE MOTHER POVERTY
16.6/ 100
METRIC RATING
204th/ 347
METRIC RANK
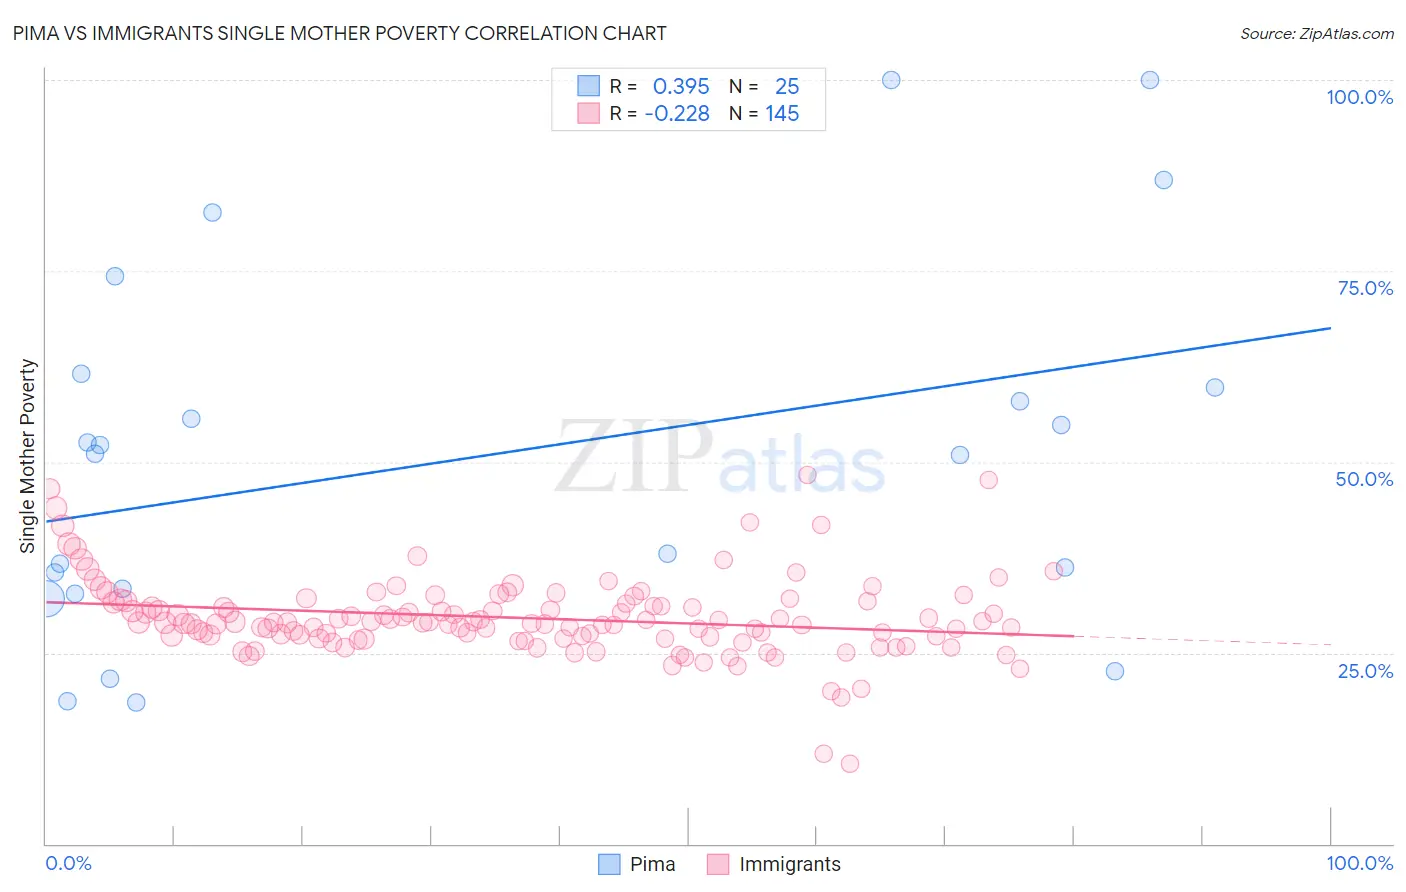
Pima vs Immigrants Single Mother Poverty Correlation Chart
The statistical analysis conducted on geographies consisting of 61,247,858 people shows a mild positive correlation between the proportion of Pima and poverty level among single mothers in the United States with a correlation coefficient (R) of 0.395 and weighted average of 38.6%. Similarly, the statistical analysis conducted on geographies consisting of 548,894,561 people shows a weak negative correlation between the proportion of Immigrants and poverty level among single mothers in the United States with a correlation coefficient (R) of -0.228 and weighted average of 29.7%, a difference of 29.8%.
Single Mother Poverty Correlation Summary
| Measurement | Pima | Immigrants |
| Minimum | 18.5% | 10.6% |
| Maximum | 100.0% | 48.3% |
| Range | 81.5% | 37.7% |
| Mean | 50.6% | 29.6% |
| Median | 51.0% | 29.0% |
| Interquartile 25% (IQ1) | 33.1% | 27.0% |
| Interquartile 75% (IQ3) | 60.6% | 31.7% |
| Interquartile Range (IQR) | 27.5% | 4.7% |
| Standard Deviation (Sample) | 23.7% | 5.3% |
| Standard Deviation (Population) | 23.3% | 5.3% |
Similar Demographics by Single Mother Poverty
Demographics Similar to Pima by Single Mother Poverty
In terms of single mother poverty, the demographic groups most similar to Pima are Crow (38.6%, a difference of 0.090%), Immigrants from Yemen (38.5%, a difference of 0.21%), Cheyenne (38.5%, a difference of 0.25%), Sioux (38.8%, a difference of 0.49%), and Colville (39.3%, a difference of 1.8%).
| Demographics | Rating | Rank | Single Mother Poverty |
| Creek | 0.0 /100 | #331 | Tragic 36.7% |
| Dutch West Indians | 0.0 /100 | #332 | Tragic 36.8% |
| Menominee | 0.0 /100 | #333 | Tragic 37.1% |
| Pueblo | 0.0 /100 | #334 | Tragic 37.2% |
| Yuman | 0.0 /100 | #335 | Tragic 37.8% |
| Cheyenne | 0.0 /100 | #336 | Tragic 38.5% |
| Immigrants | Yemen | 0.0 /100 | #337 | Tragic 38.5% |
| Pima | 0.0 /100 | #338 | Tragic 38.6% |
| Crow | 0.0 /100 | #339 | Tragic 38.6% |
| Sioux | 0.0 /100 | #340 | Tragic 38.8% |
| Colville | 0.0 /100 | #341 | Tragic 39.3% |
| Navajo | 0.0 /100 | #342 | Tragic 40.2% |
| Cajuns | 0.0 /100 | #343 | Tragic 40.3% |
| Tohono O'odham | 0.0 /100 | #344 | Tragic 43.0% |
| Lumbee | 0.0 /100 | #345 | Tragic 43.2% |
Demographics Similar to Immigrants by Single Mother Poverty
In terms of single mother poverty, the demographic groups most similar to Immigrants are Czechoslovakian (29.7%, a difference of 0.040%), Swiss (29.7%, a difference of 0.050%), Immigrants from Haiti (29.7%, a difference of 0.060%), Malaysian (29.7%, a difference of 0.070%), and Immigrants from Panama (29.8%, a difference of 0.090%).
| Demographics | Rating | Rank | Single Mother Poverty |
| Immigrants | Jamaica | 22.0 /100 | #197 | Fair 29.6% |
| Trinidadians and Tobagonians | 21.7 /100 | #198 | Fair 29.6% |
| Cubans | 20.8 /100 | #199 | Fair 29.6% |
| Panamanians | 20.0 /100 | #200 | Fair 29.6% |
| Belgians | 18.8 /100 | #201 | Poor 29.7% |
| Malaysians | 17.4 /100 | #202 | Poor 29.7% |
| Swiss | 17.2 /100 | #203 | Poor 29.7% |
| Immigrants | Immigrants | 16.6 /100 | #204 | Poor 29.7% |
| Czechoslovakians | 16.1 /100 | #205 | Poor 29.7% |
| Immigrants | Haiti | 15.8 /100 | #206 | Poor 29.7% |
| Immigrants | Panama | 15.5 /100 | #207 | Poor 29.8% |
| Immigrants | Guyana | 14.7 /100 | #208 | Poor 29.8% |
| Irish | 13.9 /100 | #209 | Poor 29.8% |
| Haitians | 13.3 /100 | #210 | Poor 29.8% |
| Guyanese | 12.8 /100 | #211 | Poor 29.8% |