Pima vs Ugandan Single Mother Poverty
COMPARE
Pima
Ugandan
Single Mother Poverty
Single Mother Poverty Comparison
Pima
Ugandans
38.6%
SINGLE MOTHER POVERTY
0.0/ 100
METRIC RATING
338th/ 347
METRIC RANK
28.8%
SINGLE MOTHER POVERTY
71.7/ 100
METRIC RATING
155th/ 347
METRIC RANK
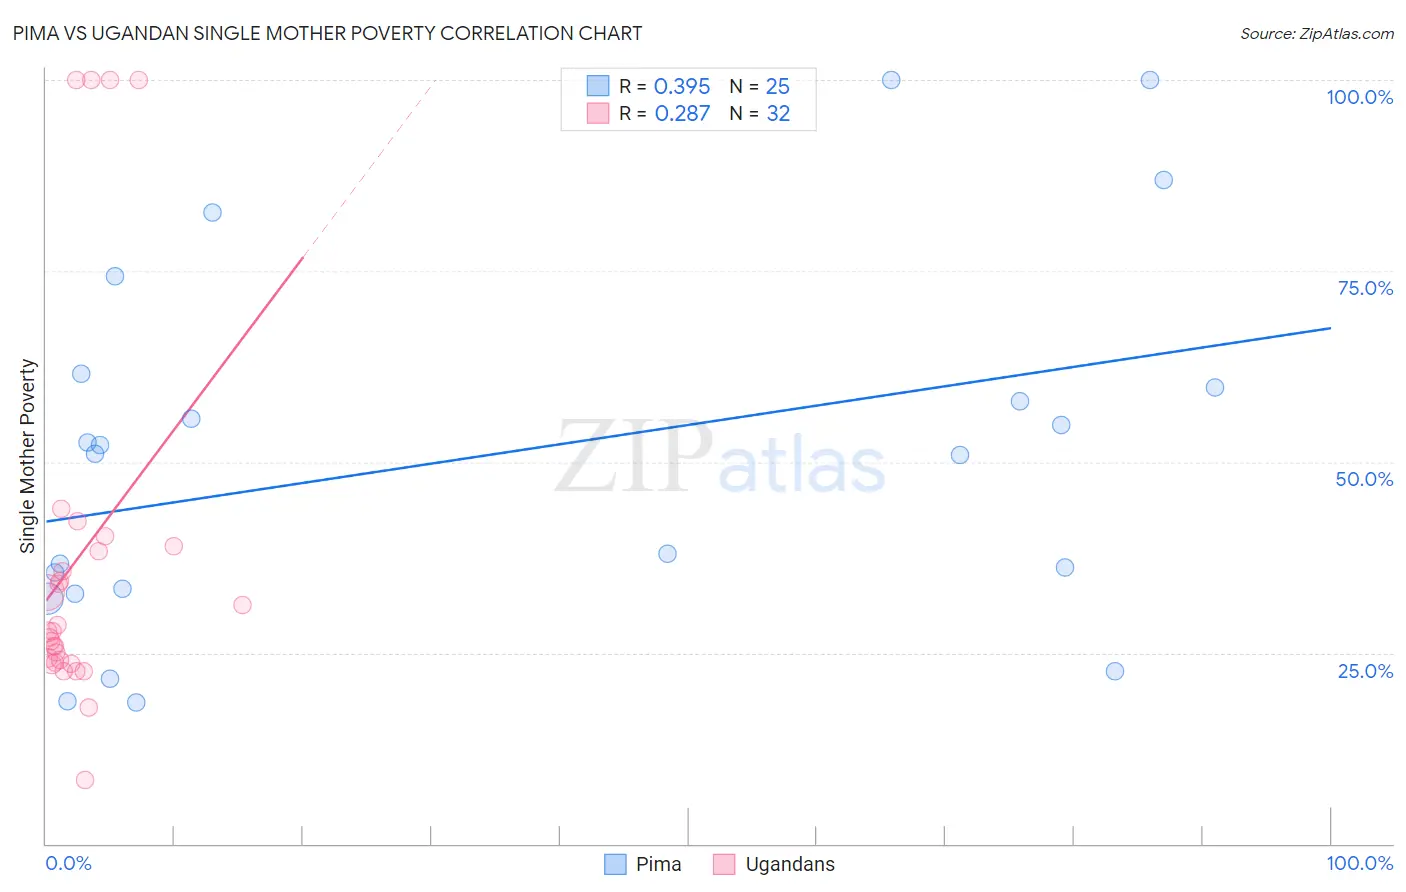
Pima vs Ugandan Single Mother Poverty Correlation Chart
The statistical analysis conducted on geographies consisting of 61,247,858 people shows a mild positive correlation between the proportion of Pima and poverty level among single mothers in the United States with a correlation coefficient (R) of 0.395 and weighted average of 38.6%. Similarly, the statistical analysis conducted on geographies consisting of 93,563,959 people shows a weak positive correlation between the proportion of Ugandans and poverty level among single mothers in the United States with a correlation coefficient (R) of 0.287 and weighted average of 28.8%, a difference of 33.8%.
Single Mother Poverty Correlation Summary
| Measurement | Pima | Ugandan |
| Minimum | 18.5% | 8.4% |
| Maximum | 100.0% | 100.0% |
| Range | 81.5% | 91.6% |
| Mean | 50.6% | 37.5% |
| Median | 51.0% | 27.8% |
| Interquartile 25% (IQ1) | 33.1% | 23.9% |
| Interquartile 75% (IQ3) | 60.6% | 38.6% |
| Interquartile Range (IQR) | 27.5% | 14.7% |
| Standard Deviation (Sample) | 23.7% | 25.1% |
| Standard Deviation (Population) | 23.3% | 24.7% |
Similar Demographics by Single Mother Poverty
Demographics Similar to Pima by Single Mother Poverty
In terms of single mother poverty, the demographic groups most similar to Pima are Crow (38.6%, a difference of 0.090%), Immigrants from Yemen (38.5%, a difference of 0.21%), Cheyenne (38.5%, a difference of 0.25%), Sioux (38.8%, a difference of 0.49%), and Colville (39.3%, a difference of 1.8%).
| Demographics | Rating | Rank | Single Mother Poverty |
| Creek | 0.0 /100 | #331 | Tragic 36.7% |
| Dutch West Indians | 0.0 /100 | #332 | Tragic 36.8% |
| Menominee | 0.0 /100 | #333 | Tragic 37.1% |
| Pueblo | 0.0 /100 | #334 | Tragic 37.2% |
| Yuman | 0.0 /100 | #335 | Tragic 37.8% |
| Cheyenne | 0.0 /100 | #336 | Tragic 38.5% |
| Immigrants | Yemen | 0.0 /100 | #337 | Tragic 38.5% |
| Pima | 0.0 /100 | #338 | Tragic 38.6% |
| Crow | 0.0 /100 | #339 | Tragic 38.6% |
| Sioux | 0.0 /100 | #340 | Tragic 38.8% |
| Colville | 0.0 /100 | #341 | Tragic 39.3% |
| Navajo | 0.0 /100 | #342 | Tragic 40.2% |
| Cajuns | 0.0 /100 | #343 | Tragic 40.3% |
| Tohono O'odham | 0.0 /100 | #344 | Tragic 43.0% |
| Lumbee | 0.0 /100 | #345 | Tragic 43.2% |
Demographics Similar to Ugandans by Single Mother Poverty
In terms of single mother poverty, the demographic groups most similar to Ugandans are Iraqi (28.8%, a difference of 0.010%), Immigrants from Western Europe (28.9%, a difference of 0.040%), Immigrants from Hungary (28.9%, a difference of 0.070%), Portuguese (28.8%, a difference of 0.090%), and Czech (28.9%, a difference of 0.19%).
| Demographics | Rating | Rank | Single Mother Poverty |
| Syrians | 85.3 /100 | #148 | Excellent 28.6% |
| Serbians | 85.0 /100 | #149 | Excellent 28.6% |
| Northern Europeans | 81.7 /100 | #150 | Excellent 28.6% |
| Immigrants | Oceania | 79.9 /100 | #151 | Good 28.7% |
| Austrians | 79.0 /100 | #152 | Good 28.7% |
| Slovenes | 76.4 /100 | #153 | Good 28.8% |
| Portuguese | 73.2 /100 | #154 | Good 28.8% |
| Ugandans | 71.7 /100 | #155 | Good 28.8% |
| Iraqis | 71.5 /100 | #156 | Good 28.8% |
| Immigrants | Western Europe | 71.1 /100 | #157 | Good 28.9% |
| Immigrants | Hungary | 70.6 /100 | #158 | Good 28.9% |
| Czechs | 68.4 /100 | #159 | Good 28.9% |
| Japanese | 68.0 /100 | #160 | Good 28.9% |
| Immigrants | Cambodia | 66.6 /100 | #161 | Good 28.9% |
| Scandinavians | 66.2 /100 | #162 | Good 28.9% |