Immigrants from Belgium vs Cypriot Single Mother Poverty
COMPARE
Immigrants from Belgium
Cypriot
Single Mother Poverty
Single Mother Poverty Comparison
Immigrants from Belgium
Cypriots
28.5%
SINGLE MOTHER POVERTY
88.5/ 100
METRIC RATING
138th/ 347
METRIC RANK
28.3%
SINGLE MOTHER POVERTY
92.3/ 100
METRIC RATING
120th/ 347
METRIC RANK
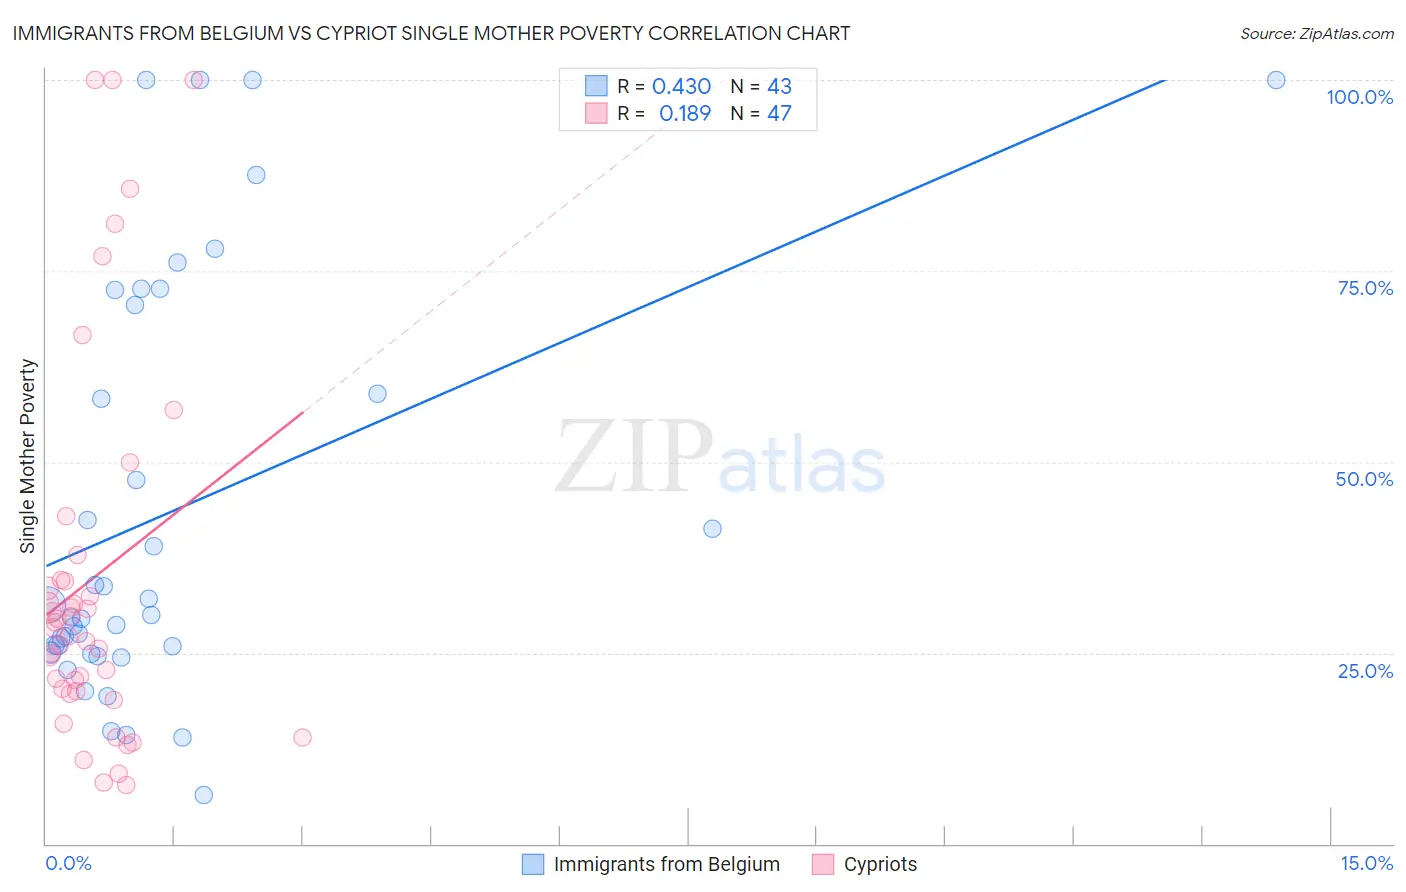
Immigrants from Belgium vs Cypriot Single Mother Poverty Correlation Chart
The statistical analysis conducted on geographies consisting of 144,308,237 people shows a moderate positive correlation between the proportion of Immigrants from Belgium and poverty level among single mothers in the United States with a correlation coefficient (R) of 0.430 and weighted average of 28.5%. Similarly, the statistical analysis conducted on geographies consisting of 61,106,831 people shows a poor positive correlation between the proportion of Cypriots and poverty level among single mothers in the United States with a correlation coefficient (R) of 0.189 and weighted average of 28.3%, a difference of 0.54%.
Single Mother Poverty Correlation Summary
| Measurement | Immigrants from Belgium | Cypriot |
| Minimum | 6.3% | 7.7% |
| Maximum | 100.0% | 100.0% |
| Range | 93.7% | 92.3% |
| Mean | 43.3% | 34.7% |
| Median | 30.0% | 28.2% |
| Interquartile 25% (IQ1) | 25.0% | 20.0% |
| Interquartile 75% (IQ3) | 70.5% | 34.6% |
| Interquartile Range (IQR) | 45.5% | 14.7% |
| Standard Deviation (Sample) | 27.1% | 24.8% |
| Standard Deviation (Population) | 26.8% | 24.5% |
Demographics Similar to Immigrants from Belgium and Cypriots by Single Mother Poverty
In terms of single mother poverty, the demographic groups most similar to Immigrants from Belgium are Native Hawaiian (28.4%, a difference of 0.050%), Immigrants from Canada (28.4%, a difference of 0.050%), Samoan (28.5%, a difference of 0.050%), Immigrants from Southern Europe (28.4%, a difference of 0.090%), and Immigrants from Spain (28.4%, a difference of 0.090%). Similarly, the demographic groups most similar to Cypriots are Immigrants from Syria (28.3%, a difference of 0.020%), Immigrants from Afghanistan (28.3%, a difference of 0.040%), Colombian (28.3%, a difference of 0.090%), Uruguayan (28.3%, a difference of 0.10%), and Immigrants from Switzerland (28.3%, a difference of 0.10%).
| Demographics | Rating | Rank | Single Mother Poverty |
| Immigrants | Syria | 92.4 /100 | #119 | Exceptional 28.3% |
| Cypriots | 92.3 /100 | #120 | Exceptional 28.3% |
| Immigrants | Afghanistan | 92.1 /100 | #121 | Exceptional 28.3% |
| Colombians | 91.8 /100 | #122 | Exceptional 28.3% |
| Uruguayans | 91.7 /100 | #123 | Exceptional 28.3% |
| Immigrants | Switzerland | 91.7 /100 | #124 | Exceptional 28.3% |
| Kenyans | 90.9 /100 | #125 | Exceptional 28.4% |
| Immigrants | Chile | 90.8 /100 | #126 | Exceptional 28.4% |
| Poles | 90.8 /100 | #127 | Exceptional 28.4% |
| Immigrants | England | 90.5 /100 | #128 | Exceptional 28.4% |
| South Americans | 90.4 /100 | #129 | Exceptional 28.4% |
| Norwegians | 90.4 /100 | #130 | Exceptional 28.4% |
| Immigrants | Austria | 90.3 /100 | #131 | Exceptional 28.4% |
| Immigrants | Morocco | 89.5 /100 | #132 | Excellent 28.4% |
| Swedes | 89.4 /100 | #133 | Excellent 28.4% |
| Immigrants | Southern Europe | 89.2 /100 | #134 | Excellent 28.4% |
| Immigrants | Spain | 89.2 /100 | #135 | Excellent 28.4% |
| Native Hawaiians | 88.9 /100 | #136 | Excellent 28.4% |
| Immigrants | Canada | 88.9 /100 | #137 | Excellent 28.4% |
| Immigrants | Belgium | 88.5 /100 | #138 | Excellent 28.5% |
| Samoans | 88.1 /100 | #139 | Excellent 28.5% |