Argentinean vs Cypriot Single Mother Poverty
COMPARE
Argentinean
Cypriot
Single Mother Poverty
Single Mother Poverty Comparison
Argentineans
Cypriots
27.2%
SINGLE MOTHER POVERTY
99.6/ 100
METRIC RATING
58th/ 347
METRIC RANK
28.3%
SINGLE MOTHER POVERTY
92.3/ 100
METRIC RATING
120th/ 347
METRIC RANK
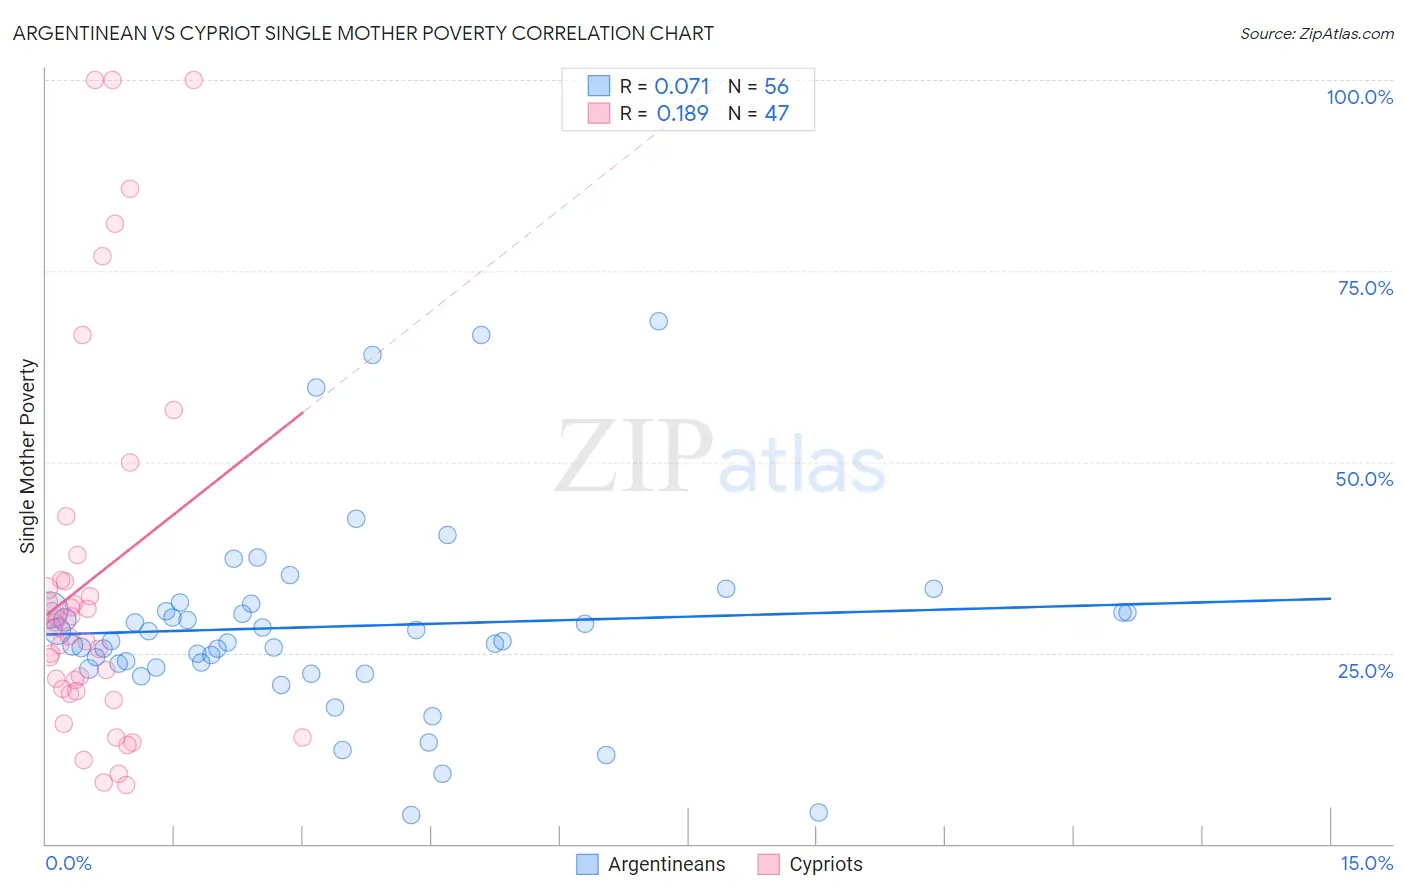
Argentinean vs Cypriot Single Mother Poverty Correlation Chart
The statistical analysis conducted on geographies consisting of 291,528,298 people shows a slight positive correlation between the proportion of Argentineans and poverty level among single mothers in the United States with a correlation coefficient (R) of 0.071 and weighted average of 27.2%. Similarly, the statistical analysis conducted on geographies consisting of 61,106,831 people shows a poor positive correlation between the proportion of Cypriots and poverty level among single mothers in the United States with a correlation coefficient (R) of 0.189 and weighted average of 28.3%, a difference of 4.0%.
Single Mother Poverty Correlation Summary
| Measurement | Argentinean | Cypriot |
| Minimum | 3.7% | 7.7% |
| Maximum | 68.3% | 100.0% |
| Range | 64.6% | 92.3% |
| Mean | 28.4% | 34.7% |
| Median | 26.5% | 28.2% |
| Interquartile 25% (IQ1) | 23.3% | 20.0% |
| Interquartile 75% (IQ3) | 30.6% | 34.6% |
| Interquartile Range (IQR) | 7.3% | 14.7% |
| Standard Deviation (Sample) | 12.7% | 24.8% |
| Standard Deviation (Population) | 12.6% | 24.5% |
Similar Demographics by Single Mother Poverty
Demographics Similar to Argentineans by Single Mother Poverty
In terms of single mother poverty, the demographic groups most similar to Argentineans are Paraguayan (27.2%, a difference of 0.010%), Eastern European (27.2%, a difference of 0.050%), Palestinian (27.2%, a difference of 0.15%), Immigrants from Eastern Europe (27.2%, a difference of 0.16%), and Immigrants from Romania (27.2%, a difference of 0.18%).
| Demographics | Rating | Rank | Single Mother Poverty |
| Immigrants | Argentina | 99.7 /100 | #51 | Exceptional 27.1% |
| Immigrants | South Eastern Asia | 99.7 /100 | #52 | Exceptional 27.1% |
| Immigrants | Jordan | 99.7 /100 | #53 | Exceptional 27.1% |
| Immigrants | Bulgaria | 99.7 /100 | #54 | Exceptional 27.1% |
| Immigrants | Egypt | 99.7 /100 | #55 | Exceptional 27.1% |
| Immigrants | Romania | 99.7 /100 | #56 | Exceptional 27.2% |
| Palestinians | 99.7 /100 | #57 | Exceptional 27.2% |
| Argentineans | 99.6 /100 | #58 | Exceptional 27.2% |
| Paraguayans | 99.6 /100 | #59 | Exceptional 27.2% |
| Eastern Europeans | 99.6 /100 | #60 | Exceptional 27.2% |
| Immigrants | Eastern Europe | 99.6 /100 | #61 | Exceptional 27.2% |
| Immigrants | Malaysia | 99.5 /100 | #62 | Exceptional 27.3% |
| Immigrants | Northern Europe | 99.5 /100 | #63 | Exceptional 27.3% |
| Russians | 99.5 /100 | #64 | Exceptional 27.3% |
| Immigrants | Turkey | 99.5 /100 | #65 | Exceptional 27.3% |
Demographics Similar to Cypriots by Single Mother Poverty
In terms of single mother poverty, the demographic groups most similar to Cypriots are Immigrants from Syria (28.3%, a difference of 0.020%), Brazilian (28.3%, a difference of 0.030%), Australian (28.3%, a difference of 0.040%), Immigrants from Afghanistan (28.3%, a difference of 0.040%), and Immigrants from Uganda (28.3%, a difference of 0.050%).
| Demographics | Rating | Rank | Single Mother Poverty |
| Immigrants | South Africa | 93.2 /100 | #113 | Exceptional 28.3% |
| Immigrants | Western Asia | 92.7 /100 | #114 | Exceptional 28.3% |
| Immigrants | Kuwait | 92.7 /100 | #115 | Exceptional 28.3% |
| Immigrants | Uganda | 92.5 /100 | #116 | Exceptional 28.3% |
| Australians | 92.5 /100 | #117 | Exceptional 28.3% |
| Brazilians | 92.4 /100 | #118 | Exceptional 28.3% |
| Immigrants | Syria | 92.4 /100 | #119 | Exceptional 28.3% |
| Cypriots | 92.3 /100 | #120 | Exceptional 28.3% |
| Immigrants | Afghanistan | 92.1 /100 | #121 | Exceptional 28.3% |
| Colombians | 91.8 /100 | #122 | Exceptional 28.3% |
| Uruguayans | 91.7 /100 | #123 | Exceptional 28.3% |
| Immigrants | Switzerland | 91.7 /100 | #124 | Exceptional 28.3% |
| Kenyans | 90.9 /100 | #125 | Exceptional 28.4% |
| Immigrants | Chile | 90.8 /100 | #126 | Exceptional 28.4% |
| Poles | 90.8 /100 | #127 | Exceptional 28.4% |