Belgian vs Cypriot Single Mother Poverty
COMPARE
Belgian
Cypriot
Single Mother Poverty
Single Mother Poverty Comparison
Belgians
Cypriots
29.7%
SINGLE MOTHER POVERTY
18.8/ 100
METRIC RATING
201st/ 347
METRIC RANK
28.3%
SINGLE MOTHER POVERTY
92.3/ 100
METRIC RATING
120th/ 347
METRIC RANK
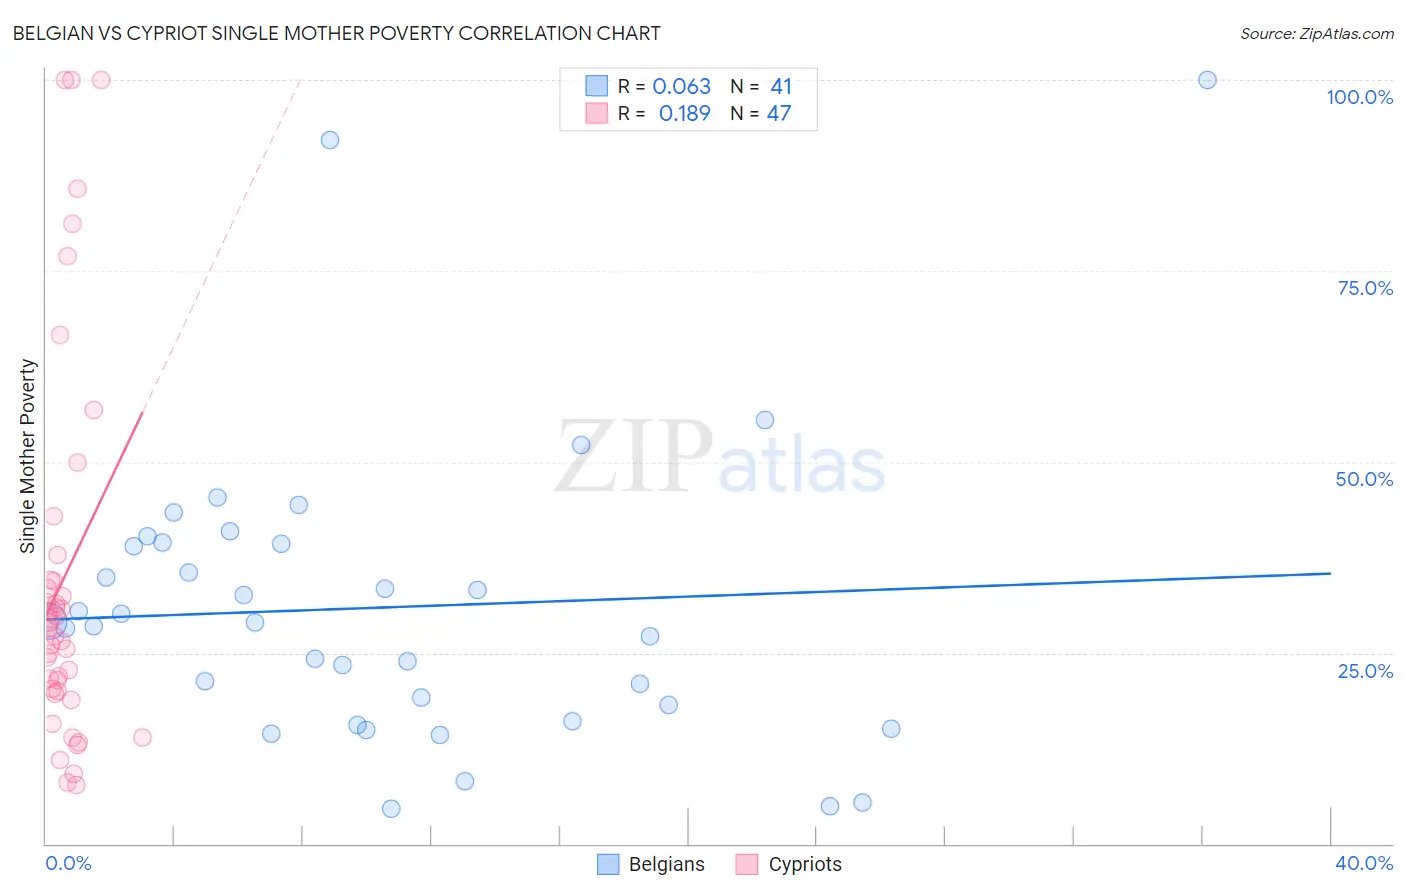
Belgian vs Cypriot Single Mother Poverty Correlation Chart
The statistical analysis conducted on geographies consisting of 346,546,144 people shows a slight positive correlation between the proportion of Belgians and poverty level among single mothers in the United States with a correlation coefficient (R) of 0.063 and weighted average of 29.7%. Similarly, the statistical analysis conducted on geographies consisting of 61,106,831 people shows a poor positive correlation between the proportion of Cypriots and poverty level among single mothers in the United States with a correlation coefficient (R) of 0.189 and weighted average of 28.3%, a difference of 4.9%.
Single Mother Poverty Correlation Summary
| Measurement | Belgian | Cypriot |
| Minimum | 4.5% | 7.7% |
| Maximum | 100.0% | 100.0% |
| Range | 95.5% | 92.3% |
| Mean | 30.9% | 34.7% |
| Median | 29.0% | 28.2% |
| Interquartile 25% (IQ1) | 17.1% | 20.0% |
| Interquartile 75% (IQ3) | 39.4% | 34.6% |
| Interquartile Range (IQR) | 22.2% | 14.7% |
| Standard Deviation (Sample) | 19.6% | 24.8% |
| Standard Deviation (Population) | 19.3% | 24.5% |
Similar Demographics by Single Mother Poverty
Demographics Similar to Belgians by Single Mother Poverty
In terms of single mother poverty, the demographic groups most similar to Belgians are Panamanian (29.6%, a difference of 0.10%), Malaysian (29.7%, a difference of 0.10%), Swiss (29.7%, a difference of 0.12%), Cuban (29.6%, a difference of 0.15%), and Immigrants (29.7%, a difference of 0.18%).
| Demographics | Rating | Rank | Single Mother Poverty |
| Icelanders | 26.1 /100 | #194 | Fair 29.5% |
| Slavs | 24.5 /100 | #195 | Fair 29.6% |
| Spanish American Indians | 23.4 /100 | #196 | Fair 29.6% |
| Immigrants | Jamaica | 22.0 /100 | #197 | Fair 29.6% |
| Trinidadians and Tobagonians | 21.7 /100 | #198 | Fair 29.6% |
| Cubans | 20.8 /100 | #199 | Fair 29.6% |
| Panamanians | 20.0 /100 | #200 | Fair 29.6% |
| Belgians | 18.8 /100 | #201 | Poor 29.7% |
| Malaysians | 17.4 /100 | #202 | Poor 29.7% |
| Swiss | 17.2 /100 | #203 | Poor 29.7% |
| Immigrants | Immigrants | 16.6 /100 | #204 | Poor 29.7% |
| Czechoslovakians | 16.1 /100 | #205 | Poor 29.7% |
| Immigrants | Haiti | 15.8 /100 | #206 | Poor 29.7% |
| Immigrants | Panama | 15.5 /100 | #207 | Poor 29.8% |
| Immigrants | Guyana | 14.7 /100 | #208 | Poor 29.8% |
Demographics Similar to Cypriots by Single Mother Poverty
In terms of single mother poverty, the demographic groups most similar to Cypriots are Immigrants from Syria (28.3%, a difference of 0.020%), Brazilian (28.3%, a difference of 0.030%), Australian (28.3%, a difference of 0.040%), Immigrants from Afghanistan (28.3%, a difference of 0.040%), and Immigrants from Uganda (28.3%, a difference of 0.050%).
| Demographics | Rating | Rank | Single Mother Poverty |
| Immigrants | South Africa | 93.2 /100 | #113 | Exceptional 28.3% |
| Immigrants | Western Asia | 92.7 /100 | #114 | Exceptional 28.3% |
| Immigrants | Kuwait | 92.7 /100 | #115 | Exceptional 28.3% |
| Immigrants | Uganda | 92.5 /100 | #116 | Exceptional 28.3% |
| Australians | 92.5 /100 | #117 | Exceptional 28.3% |
| Brazilians | 92.4 /100 | #118 | Exceptional 28.3% |
| Immigrants | Syria | 92.4 /100 | #119 | Exceptional 28.3% |
| Cypriots | 92.3 /100 | #120 | Exceptional 28.3% |
| Immigrants | Afghanistan | 92.1 /100 | #121 | Exceptional 28.3% |
| Colombians | 91.8 /100 | #122 | Exceptional 28.3% |
| Uruguayans | 91.7 /100 | #123 | Exceptional 28.3% |
| Immigrants | Switzerland | 91.7 /100 | #124 | Exceptional 28.3% |
| Kenyans | 90.9 /100 | #125 | Exceptional 28.4% |
| Immigrants | Chile | 90.8 /100 | #126 | Exceptional 28.4% |
| Poles | 90.8 /100 | #127 | Exceptional 28.4% |