Pima vs Cypriot Female Poverty
COMPARE
Pima
Cypriot
Female Poverty
Female Poverty Comparison
Pima
Cypriots
23.6%
FEMALE POVERTY
0.0/ 100
METRIC RATING
344th/ 347
METRIC RANK
11.8%
FEMALE POVERTY
99.5/ 100
METRIC RATING
33rd/ 347
METRIC RANK
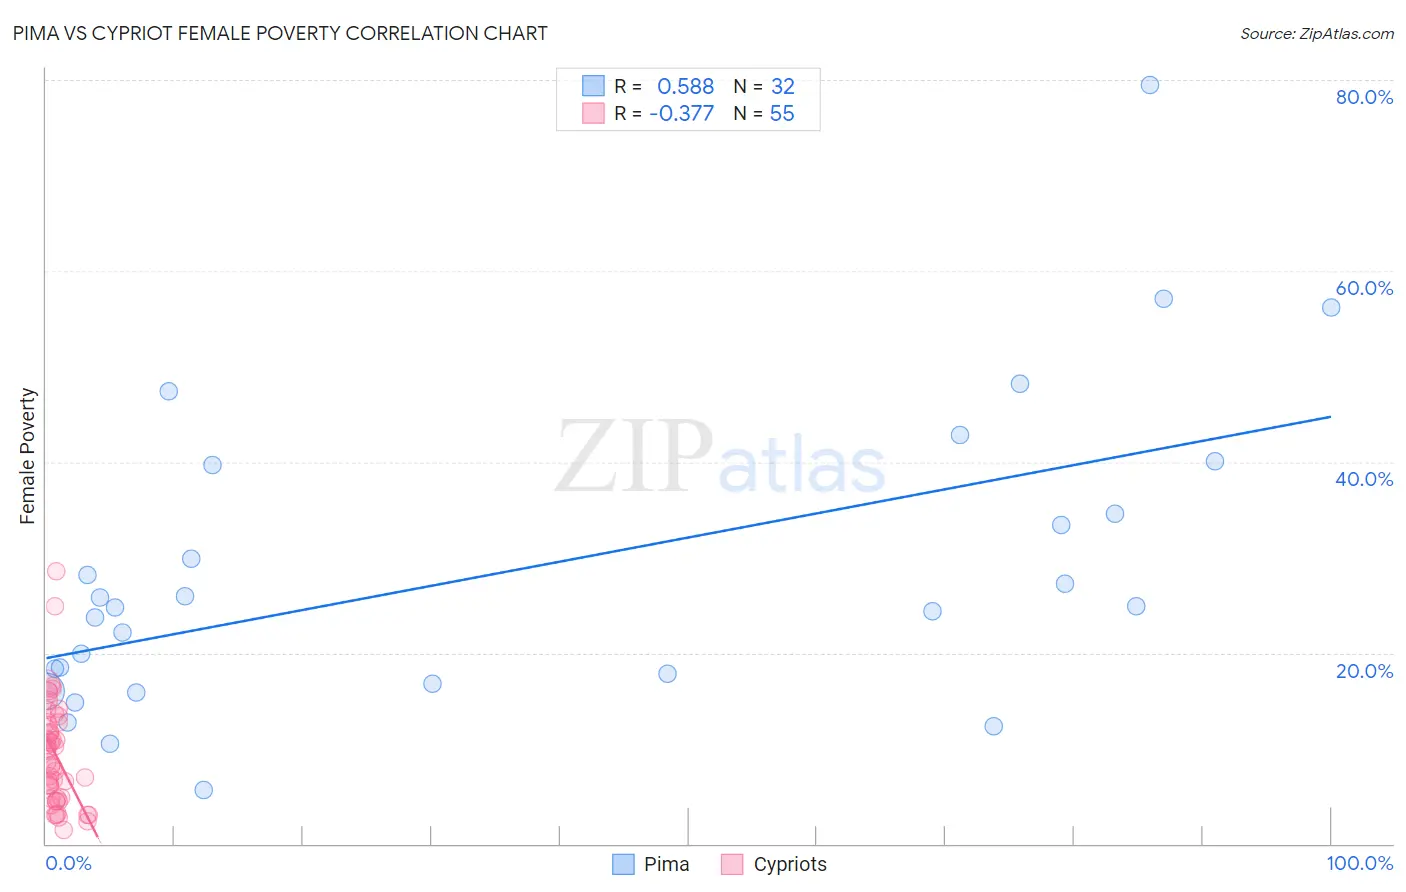
Pima vs Cypriot Female Poverty Correlation Chart
The statistical analysis conducted on geographies consisting of 61,538,212 people shows a substantial positive correlation between the proportion of Pima and poverty level among females in the United States with a correlation coefficient (R) of 0.588 and weighted average of 23.6%. Similarly, the statistical analysis conducted on geographies consisting of 61,838,205 people shows a mild negative correlation between the proportion of Cypriots and poverty level among females in the United States with a correlation coefficient (R) of -0.377 and weighted average of 11.8%, a difference of 100.6%.
Female Poverty Correlation Summary
| Measurement | Pima | Cypriot |
| Minimum | 5.7% | 1.5% |
| Maximum | 79.5% | 28.6% |
| Range | 73.8% | 27.1% |
| Mean | 28.6% | 9.4% |
| Median | 24.8% | 8.5% |
| Interquartile 25% (IQ1) | 17.3% | 4.7% |
| Interquartile 75% (IQ3) | 37.2% | 12.6% |
| Interquartile Range (IQR) | 19.9% | 7.9% |
| Standard Deviation (Sample) | 16.0% | 5.5% |
| Standard Deviation (Population) | 15.8% | 5.4% |
Similar Demographics by Female Poverty
Demographics Similar to Pima by Female Poverty
In terms of female poverty, the demographic groups most similar to Pima are Lumbee (23.5%, a difference of 0.31%), Navajo (23.9%, a difference of 1.3%), Immigrants from Yemen (22.8%, a difference of 3.3%), Crow (22.1%, a difference of 6.5%), and Puerto Rican (25.2%, a difference of 6.8%).
| Demographics | Rating | Rank | Female Poverty |
| Immigrants | Dominican Republic | 0.0 /100 | #333 | Tragic 19.3% |
| Houma | 0.0 /100 | #334 | Tragic 20.0% |
| Cheyenne | 0.0 /100 | #335 | Tragic 20.2% |
| Pueblo | 0.0 /100 | #336 | Tragic 20.7% |
| Yuman | 0.0 /100 | #337 | Tragic 20.8% |
| Sioux | 0.0 /100 | #338 | Tragic 20.9% |
| Hopi | 0.0 /100 | #339 | Tragic 21.0% |
| Yup'ik | 0.0 /100 | #340 | Tragic 21.5% |
| Crow | 0.0 /100 | #341 | Tragic 22.1% |
| Immigrants | Yemen | 0.0 /100 | #342 | Tragic 22.8% |
| Lumbee | 0.0 /100 | #343 | Tragic 23.5% |
| Pima | 0.0 /100 | #344 | Tragic 23.6% |
| Navajo | 0.0 /100 | #345 | Tragic 23.9% |
| Puerto Ricans | 0.0 /100 | #346 | Tragic 25.2% |
| Tohono O'odham | 0.0 /100 | #347 | Tragic 25.9% |
Demographics Similar to Cypriots by Female Poverty
In terms of female poverty, the demographic groups most similar to Cypriots are Danish (11.7%, a difference of 0.070%), Immigrants from Singapore (11.8%, a difference of 0.12%), Polish (11.7%, a difference of 0.21%), Immigrants from Iran (11.8%, a difference of 0.29%), and Greek (11.7%, a difference of 0.42%).
| Demographics | Rating | Rank | Female Poverty |
| Croatians | 99.6 /100 | #26 | Exceptional 11.6% |
| Iranians | 99.6 /100 | #27 | Exceptional 11.7% |
| Immigrants | Korea | 99.6 /100 | #28 | Exceptional 11.7% |
| Immigrants | North Macedonia | 99.6 /100 | #29 | Exceptional 11.7% |
| Greeks | 99.5 /100 | #30 | Exceptional 11.7% |
| Poles | 99.5 /100 | #31 | Exceptional 11.7% |
| Danes | 99.5 /100 | #32 | Exceptional 11.7% |
| Cypriots | 99.5 /100 | #33 | Exceptional 11.8% |
| Immigrants | Singapore | 99.4 /100 | #34 | Exceptional 11.8% |
| Immigrants | Iran | 99.4 /100 | #35 | Exceptional 11.8% |
| Immigrants | Pakistan | 99.4 /100 | #36 | Exceptional 11.8% |
| Immigrants | Greece | 99.3 /100 | #37 | Exceptional 11.8% |
| Russians | 99.3 /100 | #38 | Exceptional 11.8% |
| Immigrants | Poland | 99.3 /100 | #39 | Exceptional 11.8% |
| Macedonians | 99.3 /100 | #40 | Exceptional 11.8% |