Pima vs Immigrants from Sierra Leone Female Poverty
COMPARE
Pima
Immigrants from Sierra Leone
Female Poverty
Female Poverty Comparison
Pima
Immigrants from Sierra Leone
23.6%
FEMALE POVERTY
0.0/ 100
METRIC RATING
344th/ 347
METRIC RANK
13.5%
FEMALE POVERTY
43.2/ 100
METRIC RATING
184th/ 347
METRIC RANK
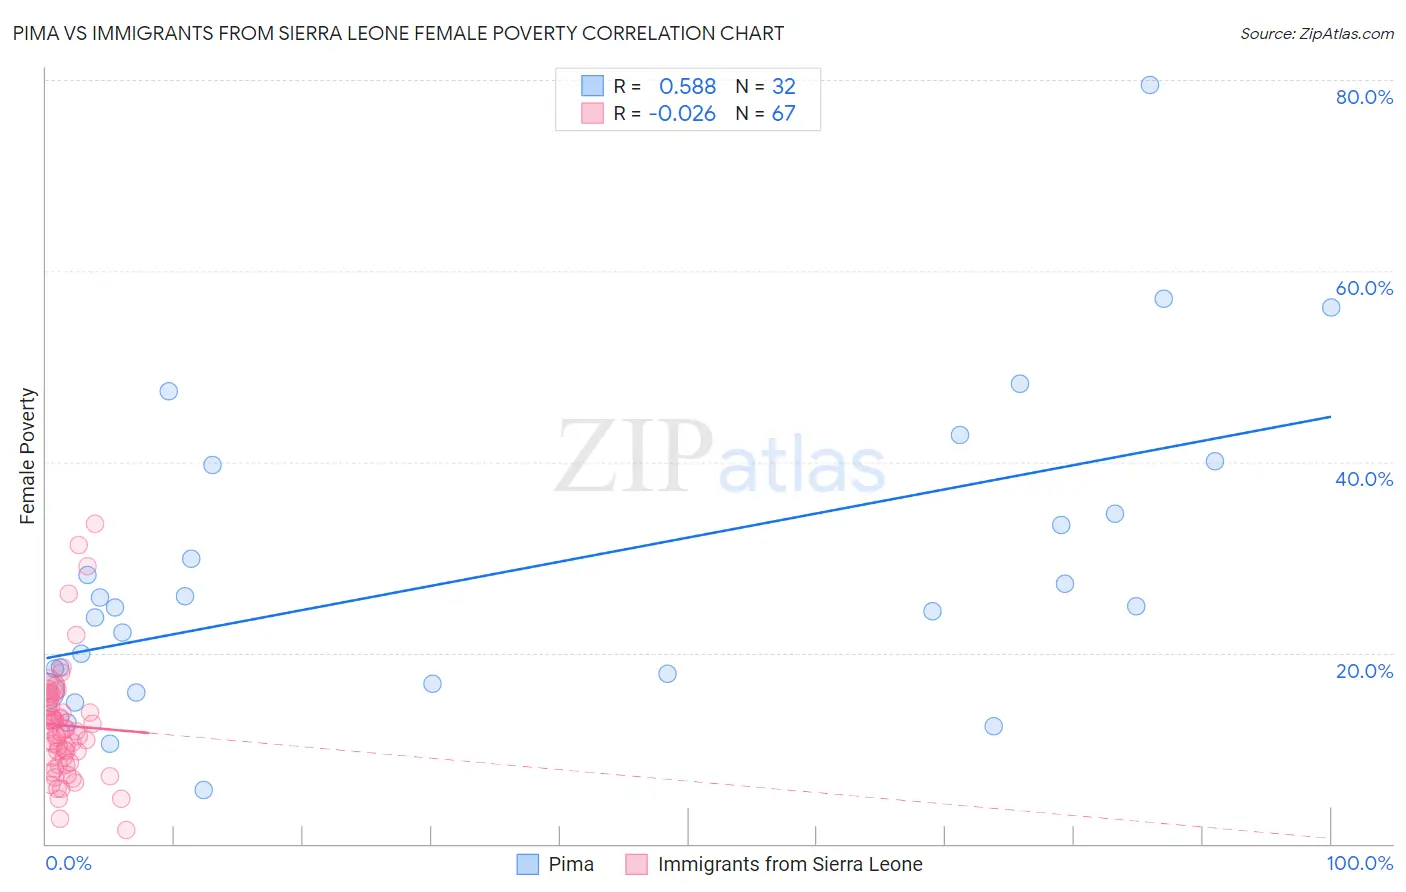
Pima vs Immigrants from Sierra Leone Female Poverty Correlation Chart
The statistical analysis conducted on geographies consisting of 61,538,212 people shows a substantial positive correlation between the proportion of Pima and poverty level among females in the United States with a correlation coefficient (R) of 0.588 and weighted average of 23.6%. Similarly, the statistical analysis conducted on geographies consisting of 101,642,339 people shows no correlation between the proportion of Immigrants from Sierra Leone and poverty level among females in the United States with a correlation coefficient (R) of -0.026 and weighted average of 13.5%, a difference of 74.3%.
Female Poverty Correlation Summary
| Measurement | Pima | Immigrants from Sierra Leone |
| Minimum | 5.7% | 1.5% |
| Maximum | 79.5% | 33.5% |
| Range | 73.8% | 32.0% |
| Mean | 28.6% | 12.4% |
| Median | 24.8% | 11.8% |
| Interquartile 25% (IQ1) | 17.3% | 8.4% |
| Interquartile 75% (IQ3) | 37.2% | 14.9% |
| Interquartile Range (IQR) | 19.9% | 6.4% |
| Standard Deviation (Sample) | 16.0% | 6.0% |
| Standard Deviation (Population) | 15.8% | 5.9% |
Similar Demographics by Female Poverty
Demographics Similar to Pima by Female Poverty
In terms of female poverty, the demographic groups most similar to Pima are Lumbee (23.5%, a difference of 0.31%), Navajo (23.9%, a difference of 1.3%), Immigrants from Yemen (22.8%, a difference of 3.3%), Crow (22.1%, a difference of 6.5%), and Puerto Rican (25.2%, a difference of 6.8%).
| Demographics | Rating | Rank | Female Poverty |
| Immigrants | Dominican Republic | 0.0 /100 | #333 | Tragic 19.3% |
| Houma | 0.0 /100 | #334 | Tragic 20.0% |
| Cheyenne | 0.0 /100 | #335 | Tragic 20.2% |
| Pueblo | 0.0 /100 | #336 | Tragic 20.7% |
| Yuman | 0.0 /100 | #337 | Tragic 20.8% |
| Sioux | 0.0 /100 | #338 | Tragic 20.9% |
| Hopi | 0.0 /100 | #339 | Tragic 21.0% |
| Yup'ik | 0.0 /100 | #340 | Tragic 21.5% |
| Crow | 0.0 /100 | #341 | Tragic 22.1% |
| Immigrants | Yemen | 0.0 /100 | #342 | Tragic 22.8% |
| Lumbee | 0.0 /100 | #343 | Tragic 23.5% |
| Pima | 0.0 /100 | #344 | Tragic 23.6% |
| Navajo | 0.0 /100 | #345 | Tragic 23.9% |
| Puerto Ricans | 0.0 /100 | #346 | Tragic 25.2% |
| Tohono O'odham | 0.0 /100 | #347 | Tragic 25.9% |
Demographics Similar to Immigrants from Sierra Leone by Female Poverty
In terms of female poverty, the demographic groups most similar to Immigrants from Sierra Leone are Kenyan (13.5%, a difference of 0.060%), Immigrants from Cameroon (13.5%, a difference of 0.11%), Venezuelan (13.5%, a difference of 0.13%), Immigrants from Colombia (13.5%, a difference of 0.13%), and South American (13.5%, a difference of 0.16%).
| Demographics | Rating | Rank | Female Poverty |
| Immigrants | Morocco | 49.4 /100 | #177 | Average 13.4% |
| Israelis | 49.1 /100 | #178 | Average 13.5% |
| Immigrants | Syria | 48.8 /100 | #179 | Average 13.5% |
| South Americans | 44.8 /100 | #180 | Average 13.5% |
| Venezuelans | 44.5 /100 | #181 | Average 13.5% |
| Immigrants | Colombia | 44.5 /100 | #182 | Average 13.5% |
| Kenyans | 43.8 /100 | #183 | Average 13.5% |
| Immigrants | Sierra Leone | 43.2 /100 | #184 | Average 13.5% |
| Immigrants | Cameroon | 42.0 /100 | #185 | Average 13.5% |
| Immigrants | Portugal | 41.5 /100 | #186 | Average 13.6% |
| Immigrants | Venezuela | 41.0 /100 | #187 | Average 13.6% |
| Hawaiians | 39.9 /100 | #188 | Fair 13.6% |
| Uruguayans | 39.8 /100 | #189 | Fair 13.6% |
| Sierra Leoneans | 33.1 /100 | #190 | Fair 13.7% |
| Immigrants | Kuwait | 32.7 /100 | #191 | Fair 13.7% |