Romanian vs Cypriot Female Poverty
COMPARE
Romanian
Cypriot
Female Poverty
Female Poverty Comparison
Romanians
Cypriots
12.5%
FEMALE POVERTY
95.1/ 100
METRIC RATING
99th/ 347
METRIC RANK
11.8%
FEMALE POVERTY
99.5/ 100
METRIC RATING
33rd/ 347
METRIC RANK
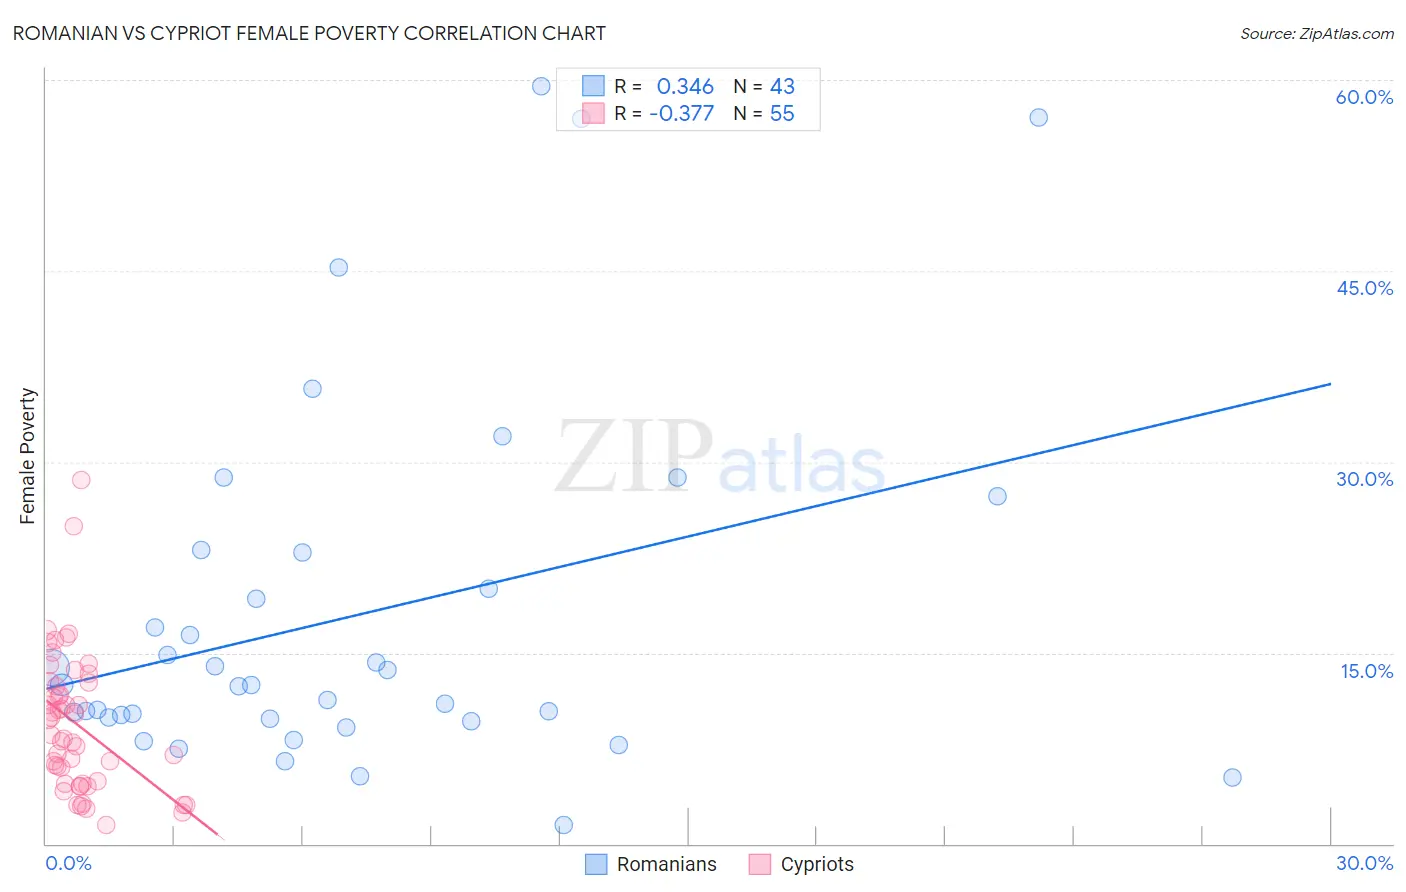
Romanian vs Cypriot Female Poverty Correlation Chart
The statistical analysis conducted on geographies consisting of 377,651,231 people shows a mild positive correlation between the proportion of Romanians and poverty level among females in the United States with a correlation coefficient (R) of 0.346 and weighted average of 12.5%. Similarly, the statistical analysis conducted on geographies consisting of 61,838,205 people shows a mild negative correlation between the proportion of Cypriots and poverty level among females in the United States with a correlation coefficient (R) of -0.377 and weighted average of 11.8%, a difference of 6.2%.
Female Poverty Correlation Summary
| Measurement | Romanian | Cypriot |
| Minimum | 1.5% | 1.5% |
| Maximum | 59.5% | 28.6% |
| Range | 58.0% | 27.1% |
| Mean | 17.9% | 9.4% |
| Median | 12.5% | 8.5% |
| Interquartile 25% (IQ1) | 9.8% | 4.7% |
| Interquartile 75% (IQ3) | 22.9% | 12.6% |
| Interquartile Range (IQR) | 13.1% | 7.9% |
| Standard Deviation (Sample) | 14.2% | 5.5% |
| Standard Deviation (Population) | 14.0% | 5.4% |
Similar Demographics by Female Poverty
Demographics Similar to Romanians by Female Poverty
In terms of female poverty, the demographic groups most similar to Romanians are Native Hawaiian (12.5%, a difference of 0.020%), Australian (12.5%, a difference of 0.050%), British (12.5%, a difference of 0.070%), Immigrants from South Africa (12.5%, a difference of 0.15%), and Immigrants from Latvia (12.5%, a difference of 0.15%).
| Demographics | Rating | Rank | Female Poverty |
| Czechoslovakians | 95.7 /100 | #92 | Exceptional 12.4% |
| Immigrants | Egypt | 95.5 /100 | #93 | Exceptional 12.5% |
| Immigrants | Indonesia | 95.4 /100 | #94 | Exceptional 12.5% |
| Immigrants | South Africa | 95.4 /100 | #95 | Exceptional 12.5% |
| British | 95.2 /100 | #96 | Exceptional 12.5% |
| Australians | 95.2 /100 | #97 | Exceptional 12.5% |
| Native Hawaiians | 95.1 /100 | #98 | Exceptional 12.5% |
| Romanians | 95.1 /100 | #99 | Exceptional 12.5% |
| Immigrants | Latvia | 94.8 /100 | #100 | Exceptional 12.5% |
| Tlingit-Haida | 94.8 /100 | #101 | Exceptional 12.5% |
| Immigrants | China | 94.5 /100 | #102 | Exceptional 12.5% |
| Slavs | 94.5 /100 | #103 | Exceptional 12.5% |
| Palestinians | 94.3 /100 | #104 | Exceptional 12.5% |
| Scottish | 94.1 /100 | #105 | Exceptional 12.5% |
| Immigrants | Turkey | 93.8 /100 | #106 | Exceptional 12.6% |
Demographics Similar to Cypriots by Female Poverty
In terms of female poverty, the demographic groups most similar to Cypriots are Danish (11.7%, a difference of 0.070%), Immigrants from Singapore (11.8%, a difference of 0.12%), Polish (11.7%, a difference of 0.21%), Immigrants from Iran (11.8%, a difference of 0.29%), and Greek (11.7%, a difference of 0.42%).
| Demographics | Rating | Rank | Female Poverty |
| Croatians | 99.6 /100 | #26 | Exceptional 11.6% |
| Iranians | 99.6 /100 | #27 | Exceptional 11.7% |
| Immigrants | Korea | 99.6 /100 | #28 | Exceptional 11.7% |
| Immigrants | North Macedonia | 99.6 /100 | #29 | Exceptional 11.7% |
| Greeks | 99.5 /100 | #30 | Exceptional 11.7% |
| Poles | 99.5 /100 | #31 | Exceptional 11.7% |
| Danes | 99.5 /100 | #32 | Exceptional 11.7% |
| Cypriots | 99.5 /100 | #33 | Exceptional 11.8% |
| Immigrants | Singapore | 99.4 /100 | #34 | Exceptional 11.8% |
| Immigrants | Iran | 99.4 /100 | #35 | Exceptional 11.8% |
| Immigrants | Pakistan | 99.4 /100 | #36 | Exceptional 11.8% |
| Immigrants | Greece | 99.3 /100 | #37 | Exceptional 11.8% |
| Russians | 99.3 /100 | #38 | Exceptional 11.8% |
| Immigrants | Poland | 99.3 /100 | #39 | Exceptional 11.8% |
| Macedonians | 99.3 /100 | #40 | Exceptional 11.8% |