Pennsylvania German vs Immigrants from Japan Female Poverty
COMPARE
Pennsylvania German
Immigrants from Japan
Female Poverty
Female Poverty Comparison
Pennsylvania Germans
Immigrants from Japan
13.2%
FEMALE POVERTY
67.3/ 100
METRIC RATING
158th/ 347
METRIC RANK
11.9%
FEMALE POVERTY
99.0/ 100
METRIC RATING
48th/ 347
METRIC RANK
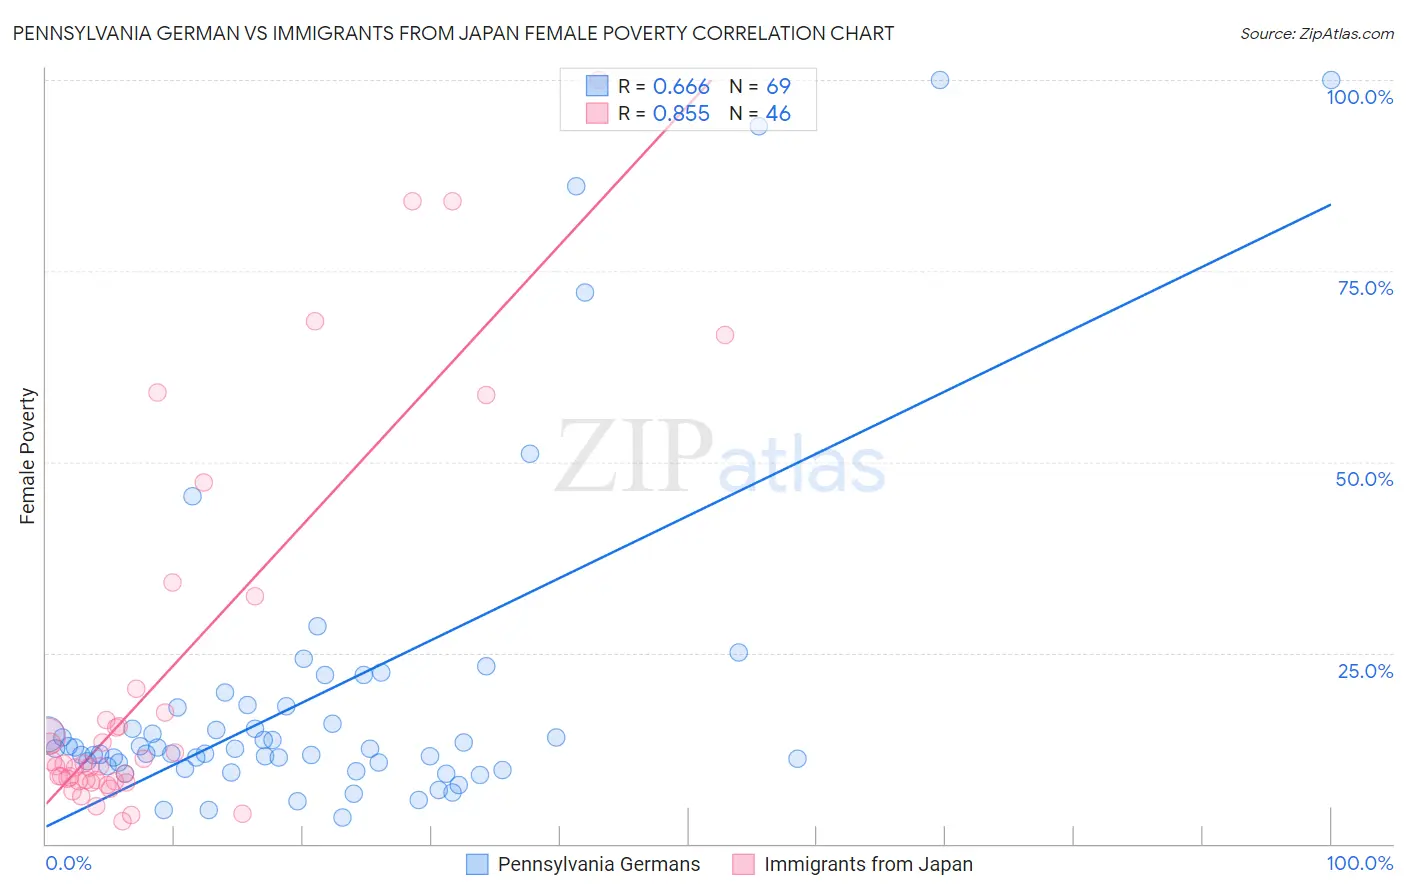
Pennsylvania German vs Immigrants from Japan Female Poverty Correlation Chart
The statistical analysis conducted on geographies consisting of 233,998,353 people shows a significant positive correlation between the proportion of Pennsylvania Germans and poverty level among females in the United States with a correlation coefficient (R) of 0.666 and weighted average of 13.2%. Similarly, the statistical analysis conducted on geographies consisting of 339,963,649 people shows a very strong positive correlation between the proportion of Immigrants from Japan and poverty level among females in the United States with a correlation coefficient (R) of 0.855 and weighted average of 11.9%, a difference of 10.5%.
Female Poverty Correlation Summary
| Measurement | Pennsylvania German | Immigrants from Japan |
| Minimum | 3.4% | 2.9% |
| Maximum | 100.0% | 100.0% |
| Range | 96.6% | 97.1% |
| Mean | 19.5% | 21.6% |
| Median | 12.4% | 10.3% |
| Interquartile 25% (IQ1) | 10.4% | 8.2% |
| Interquartile 75% (IQ3) | 17.9% | 17.1% |
| Interquartile Range (IQR) | 7.5% | 9.0% |
| Standard Deviation (Sample) | 21.6% | 24.6% |
| Standard Deviation (Population) | 21.5% | 24.4% |
Similar Demographics by Female Poverty
Demographics Similar to Pennsylvania Germans by Female Poverty
In terms of female poverty, the demographic groups most similar to Pennsylvania Germans are Immigrants from Northern Africa (13.2%, a difference of 0.17%), Immigrants from Bosnia and Herzegovina (13.2%, a difference of 0.27%), Hungarian (13.2%, a difference of 0.32%), Armenian (13.2%, a difference of 0.36%), and Costa Rican (13.3%, a difference of 0.41%).
| Demographics | Rating | Rank | Female Poverty |
| Immigrants | Germany | 74.9 /100 | #151 | Good 13.1% |
| Samoans | 73.6 /100 | #152 | Good 13.1% |
| Immigrants | Fiji | 71.0 /100 | #153 | Good 13.2% |
| Armenians | 70.4 /100 | #154 | Good 13.2% |
| Hungarians | 70.1 /100 | #155 | Good 13.2% |
| Immigrants | Bosnia and Herzegovina | 69.7 /100 | #156 | Good 13.2% |
| Immigrants | Northern Africa | 68.8 /100 | #157 | Good 13.2% |
| Pennsylvania Germans | 67.3 /100 | #158 | Good 13.2% |
| Costa Ricans | 63.6 /100 | #159 | Good 13.3% |
| Immigrants | Nepal | 62.7 /100 | #160 | Good 13.3% |
| Immigrants | Ethiopia | 62.5 /100 | #161 | Good 13.3% |
| Guamanians/Chamorros | 62.4 /100 | #162 | Good 13.3% |
| Immigrants | Albania | 62.4 /100 | #163 | Good 13.3% |
| Ethiopians | 62.3 /100 | #164 | Good 13.3% |
| Scotch-Irish | 62.1 /100 | #165 | Good 13.3% |
Demographics Similar to Immigrants from Japan by Female Poverty
In terms of female poverty, the demographic groups most similar to Immigrants from Japan are Immigrants from Romania (12.0%, a difference of 0.19%), Slovene (12.0%, a difference of 0.20%), Asian (11.9%, a difference of 0.23%), Immigrants from Bulgaria (12.0%, a difference of 0.42%), and Turkish (11.9%, a difference of 0.44%).
| Demographics | Rating | Rank | Female Poverty |
| Czechs | 99.2 /100 | #41 | Exceptional 11.9% |
| Immigrants | Moldova | 99.2 /100 | #42 | Exceptional 11.9% |
| Koreans | 99.2 /100 | #43 | Exceptional 11.9% |
| Tongans | 99.2 /100 | #44 | Exceptional 11.9% |
| Immigrants | Czechoslovakia | 99.2 /100 | #45 | Exceptional 11.9% |
| Turks | 99.2 /100 | #46 | Exceptional 11.9% |
| Asians | 99.1 /100 | #47 | Exceptional 11.9% |
| Immigrants | Japan | 99.0 /100 | #48 | Exceptional 11.9% |
| Immigrants | Romania | 99.0 /100 | #49 | Exceptional 12.0% |
| Slovenes | 98.9 /100 | #50 | Exceptional 12.0% |
| Immigrants | Bulgaria | 98.9 /100 | #51 | Exceptional 12.0% |
| Immigrants | Croatia | 98.7 /100 | #52 | Exceptional 12.0% |
| Immigrants | Austria | 98.7 /100 | #53 | Exceptional 12.0% |
| Immigrants | Philippines | 98.7 /100 | #54 | Exceptional 12.1% |
| Immigrants | Sri Lanka | 98.5 /100 | #55 | Exceptional 12.1% |