Pennsylvania German vs German Russian Family Poverty
COMPARE
Pennsylvania German
German Russian
Family Poverty
Family Poverty Comparison
Pennsylvania Germans
German Russians
8.8%
FAMILY POVERTY
66.0/ 100
METRIC RATING
163rd/ 347
METRIC RANK
9.4%
FAMILY POVERTY
19.4/ 100
METRIC RATING
203rd/ 347
METRIC RANK
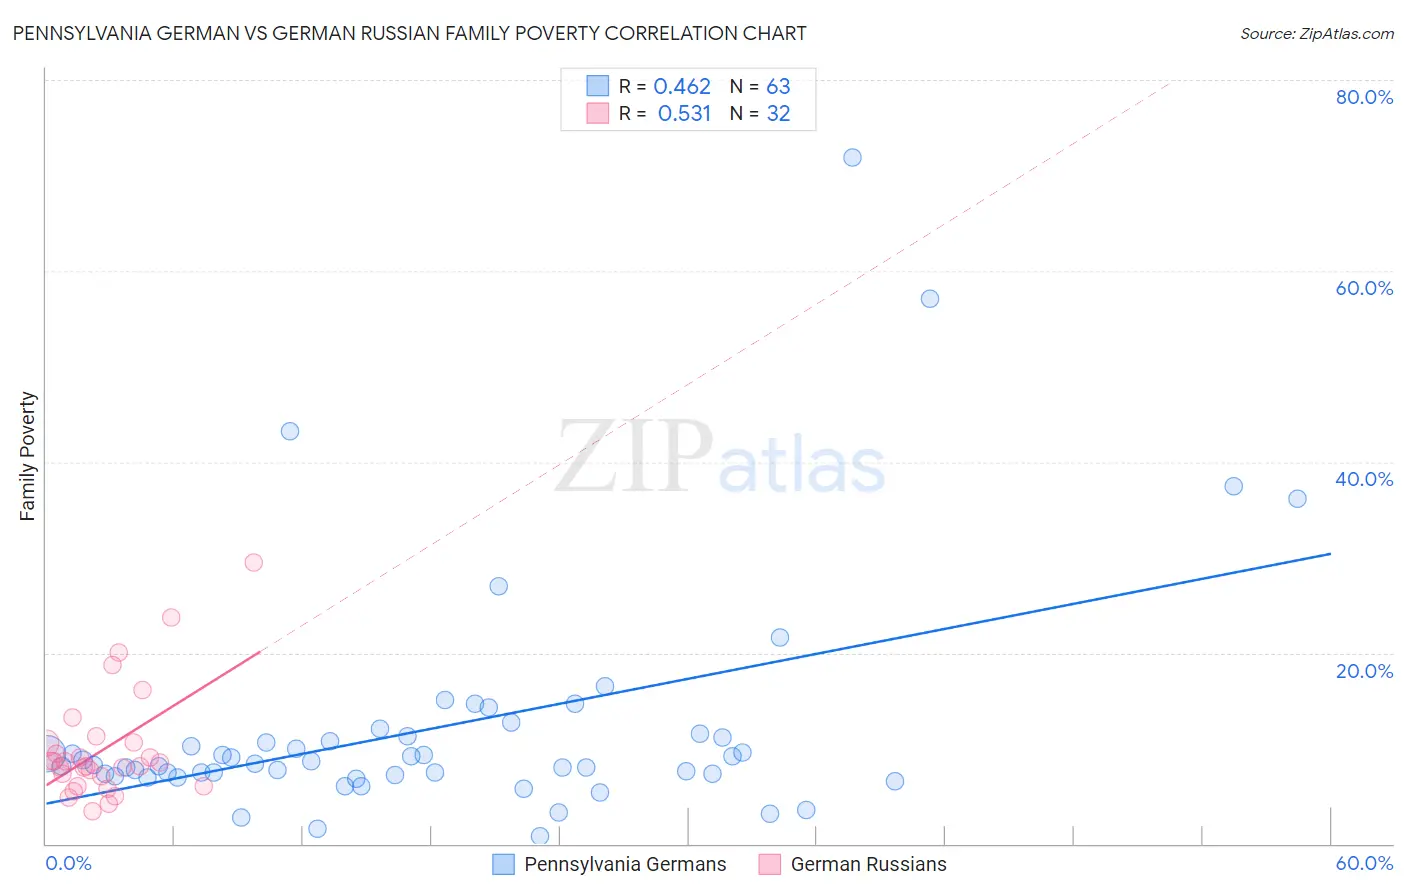
Pennsylvania German vs German Russian Family Poverty Correlation Chart
The statistical analysis conducted on geographies consisting of 233,657,746 people shows a moderate positive correlation between the proportion of Pennsylvania Germans and poverty level among families in the United States with a correlation coefficient (R) of 0.462 and weighted average of 8.8%. Similarly, the statistical analysis conducted on geographies consisting of 96,398,519 people shows a substantial positive correlation between the proportion of German Russians and poverty level among families in the United States with a correlation coefficient (R) of 0.531 and weighted average of 9.4%, a difference of 7.0%.
Family Poverty Correlation Summary
| Measurement | Pennsylvania German | German Russian |
| Minimum | 0.74% | 3.4% |
| Maximum | 71.9% | 29.4% |
| Range | 71.1% | 26.0% |
| Mean | 12.1% | 10.0% |
| Median | 8.4% | 8.4% |
| Interquartile 25% (IQ1) | 7.2% | 6.5% |
| Interquartile 75% (IQ3) | 11.3% | 10.6% |
| Interquartile Range (IQR) | 4.1% | 4.1% |
| Standard Deviation (Sample) | 12.3% | 5.8% |
| Standard Deviation (Population) | 12.2% | 5.7% |
Similar Demographics by Family Poverty
Demographics Similar to Pennsylvania Germans by Family Poverty
In terms of family poverty, the demographic groups most similar to Pennsylvania Germans are Ethiopian (8.8%, a difference of 0.050%), Immigrants from Northern Africa (8.8%, a difference of 0.14%), Celtic (8.8%, a difference of 0.16%), Hungarian (8.8%, a difference of 0.18%), and Guamanian/Chamorro (8.8%, a difference of 0.19%).
| Demographics | Rating | Rank | Family Poverty |
| Immigrants | Oceania | 71.2 /100 | #156 | Good 8.7% |
| Tsimshian | 69.3 /100 | #157 | Good 8.8% |
| Whites/Caucasians | 69.1 /100 | #158 | Good 8.8% |
| Peruvians | 68.0 /100 | #159 | Good 8.8% |
| Hungarians | 67.2 /100 | #160 | Good 8.8% |
| Immigrants | Northern Africa | 66.9 /100 | #161 | Good 8.8% |
| Ethiopians | 66.3 /100 | #162 | Good 8.8% |
| Pennsylvania Germans | 66.0 /100 | #163 | Good 8.8% |
| Celtics | 64.9 /100 | #164 | Good 8.8% |
| Guamanians/Chamorros | 64.7 /100 | #165 | Good 8.8% |
| Afghans | 63.5 /100 | #166 | Good 8.8% |
| Immigrants | Ethiopia | 62.5 /100 | #167 | Good 8.9% |
| Israelis | 62.1 /100 | #168 | Good 8.9% |
| Immigrants | Chile | 59.6 /100 | #169 | Average 8.9% |
| Kenyans | 58.2 /100 | #170 | Average 8.9% |
Demographics Similar to German Russians by Family Poverty
In terms of family poverty, the demographic groups most similar to German Russians are Immigrants from Sierra Leone (9.4%, a difference of 0.040%), Immigrants from Lebanon (9.4%, a difference of 0.10%), Immigrants from Portugal (9.4%, a difference of 0.21%), Aleut (9.5%, a difference of 0.29%), and Immigrants from South America (9.5%, a difference of 0.30%).
| Demographics | Rating | Rank | Family Poverty |
| Immigrants | Venezuela | 26.1 /100 | #196 | Fair 9.3% |
| Immigrants | Colombia | 24.4 /100 | #197 | Fair 9.3% |
| Iraqis | 24.2 /100 | #198 | Fair 9.3% |
| Spaniards | 22.8 /100 | #199 | Fair 9.4% |
| Immigrants | Costa Rica | 21.7 /100 | #200 | Fair 9.4% |
| Immigrants | Portugal | 20.5 /100 | #201 | Fair 9.4% |
| Immigrants | Sierra Leone | 19.6 /100 | #202 | Poor 9.4% |
| German Russians | 19.4 /100 | #203 | Poor 9.4% |
| Immigrants | Lebanon | 18.9 /100 | #204 | Poor 9.4% |
| Aleuts | 18.0 /100 | #205 | Poor 9.5% |
| Immigrants | South America | 18.0 /100 | #206 | Poor 9.5% |
| Sierra Leoneans | 15.6 /100 | #207 | Poor 9.5% |
| Immigrants | Eastern Africa | 15.1 /100 | #208 | Poor 9.5% |
| Immigrants | Uruguay | 14.0 /100 | #209 | Poor 9.5% |
| Alsatians | 11.3 /100 | #210 | Poor 9.6% |