Pennsylvania German vs Immigrants from Honduras Family Poverty
COMPARE
Pennsylvania German
Immigrants from Honduras
Family Poverty
Family Poverty Comparison
Pennsylvania Germans
Immigrants from Honduras
8.8%
FAMILY POVERTY
66.0/ 100
METRIC RATING
163rd/ 347
METRIC RANK
12.7%
FAMILY POVERTY
0.0/ 100
METRIC RATING
322nd/ 347
METRIC RANK
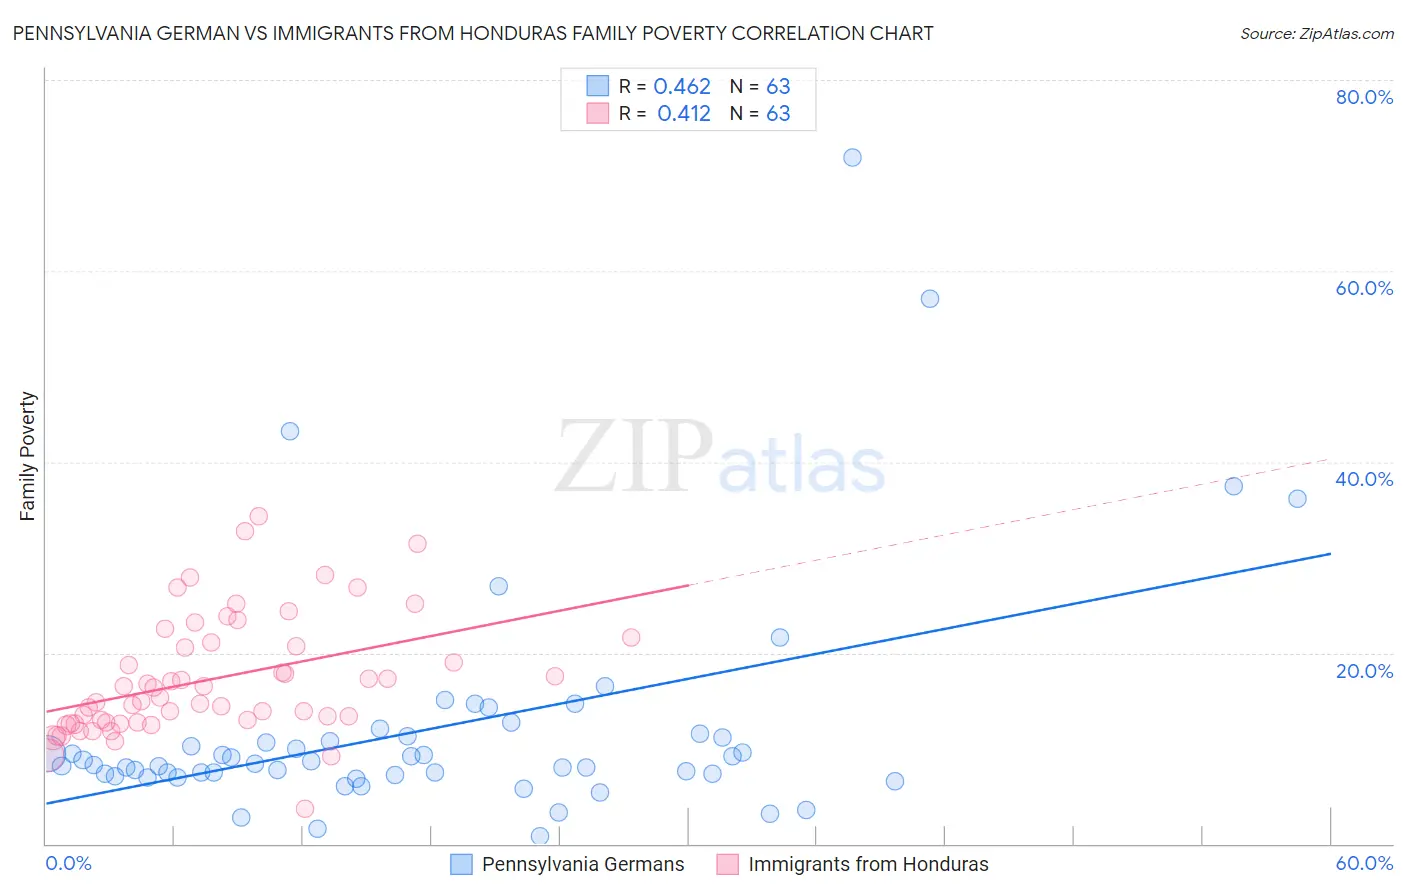
Pennsylvania German vs Immigrants from Honduras Family Poverty Correlation Chart
The statistical analysis conducted on geographies consisting of 233,657,746 people shows a moderate positive correlation between the proportion of Pennsylvania Germans and poverty level among families in the United States with a correlation coefficient (R) of 0.462 and weighted average of 8.8%. Similarly, the statistical analysis conducted on geographies consisting of 322,221,893 people shows a moderate positive correlation between the proportion of Immigrants from Honduras and poverty level among families in the United States with a correlation coefficient (R) of 0.412 and weighted average of 12.7%, a difference of 43.8%.
Family Poverty Correlation Summary
| Measurement | Pennsylvania German | Immigrants from Honduras |
| Minimum | 0.74% | 3.7% |
| Maximum | 71.9% | 34.3% |
| Range | 71.1% | 30.6% |
| Mean | 12.1% | 17.2% |
| Median | 8.4% | 15.3% |
| Interquartile 25% (IQ1) | 7.2% | 12.7% |
| Interquartile 75% (IQ3) | 11.3% | 21.1% |
| Interquartile Range (IQR) | 4.1% | 8.5% |
| Standard Deviation (Sample) | 12.3% | 6.2% |
| Standard Deviation (Population) | 12.2% | 6.2% |
Similar Demographics by Family Poverty
Demographics Similar to Pennsylvania Germans by Family Poverty
In terms of family poverty, the demographic groups most similar to Pennsylvania Germans are Ethiopian (8.8%, a difference of 0.050%), Immigrants from Northern Africa (8.8%, a difference of 0.14%), Celtic (8.8%, a difference of 0.16%), Hungarian (8.8%, a difference of 0.18%), and Guamanian/Chamorro (8.8%, a difference of 0.19%).
| Demographics | Rating | Rank | Family Poverty |
| Immigrants | Oceania | 71.2 /100 | #156 | Good 8.7% |
| Tsimshian | 69.3 /100 | #157 | Good 8.8% |
| Whites/Caucasians | 69.1 /100 | #158 | Good 8.8% |
| Peruvians | 68.0 /100 | #159 | Good 8.8% |
| Hungarians | 67.2 /100 | #160 | Good 8.8% |
| Immigrants | Northern Africa | 66.9 /100 | #161 | Good 8.8% |
| Ethiopians | 66.3 /100 | #162 | Good 8.8% |
| Pennsylvania Germans | 66.0 /100 | #163 | Good 8.8% |
| Celtics | 64.9 /100 | #164 | Good 8.8% |
| Guamanians/Chamorros | 64.7 /100 | #165 | Good 8.8% |
| Afghans | 63.5 /100 | #166 | Good 8.8% |
| Immigrants | Ethiopia | 62.5 /100 | #167 | Good 8.9% |
| Israelis | 62.1 /100 | #168 | Good 8.9% |
| Immigrants | Chile | 59.6 /100 | #169 | Average 8.9% |
| Kenyans | 58.2 /100 | #170 | Average 8.9% |
Demographics Similar to Immigrants from Honduras by Family Poverty
In terms of family poverty, the demographic groups most similar to Immigrants from Honduras are Arapaho (12.7%, a difference of 0.10%), Menominee (12.7%, a difference of 0.54%), Immigrants from Dominica (12.7%, a difference of 0.62%), Inupiat (12.5%, a difference of 1.6%), and British West Indian (12.4%, a difference of 2.1%).
| Demographics | Rating | Rank | Family Poverty |
| Immigrants | Mexico | 0.0 /100 | #315 | Tragic 12.3% |
| Hondurans | 0.0 /100 | #316 | Tragic 12.4% |
| Immigrants | Grenada | 0.0 /100 | #317 | Tragic 12.4% |
| U.S. Virgin Islanders | 0.0 /100 | #318 | Tragic 12.4% |
| British West Indians | 0.0 /100 | #319 | Tragic 12.4% |
| Inupiat | 0.0 /100 | #320 | Tragic 12.5% |
| Arapaho | 0.0 /100 | #321 | Tragic 12.7% |
| Immigrants | Honduras | 0.0 /100 | #322 | Tragic 12.7% |
| Menominee | 0.0 /100 | #323 | Tragic 12.7% |
| Immigrants | Dominica | 0.0 /100 | #324 | Tragic 12.7% |
| Paiute | 0.0 /100 | #325 | Tragic 13.0% |
| Colville | 0.0 /100 | #326 | Tragic 13.0% |
| Yakama | 0.0 /100 | #327 | Tragic 13.1% |
| Central American Indians | 0.0 /100 | #328 | Tragic 13.3% |
| Blacks/African Americans | 0.0 /100 | #329 | Tragic 13.3% |