Pennsylvania German vs Immigrants from Laos Family Poverty
COMPARE
Pennsylvania German
Immigrants from Laos
Family Poverty
Family Poverty Comparison
Pennsylvania Germans
Immigrants from Laos
8.8%
FAMILY POVERTY
66.0/ 100
METRIC RATING
163rd/ 347
METRIC RANK
10.2%
FAMILY POVERTY
1.7/ 100
METRIC RATING
237th/ 347
METRIC RANK
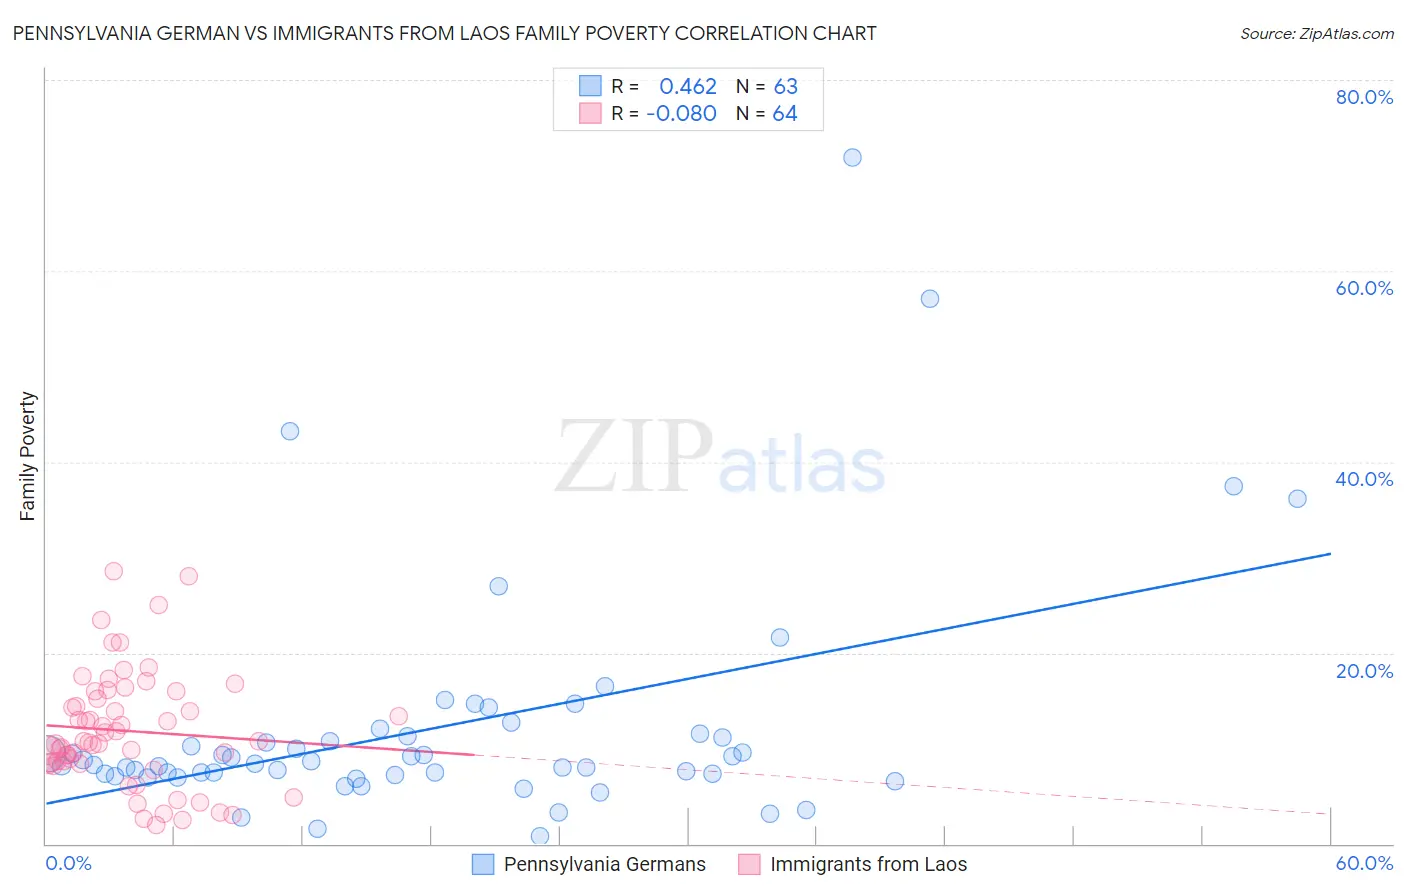
Pennsylvania German vs Immigrants from Laos Family Poverty Correlation Chart
The statistical analysis conducted on geographies consisting of 233,657,746 people shows a moderate positive correlation between the proportion of Pennsylvania Germans and poverty level among families in the United States with a correlation coefficient (R) of 0.462 and weighted average of 8.8%. Similarly, the statistical analysis conducted on geographies consisting of 201,335,644 people shows a slight negative correlation between the proportion of Immigrants from Laos and poverty level among families in the United States with a correlation coefficient (R) of -0.080 and weighted average of 10.2%, a difference of 15.8%.
Family Poverty Correlation Summary
| Measurement | Pennsylvania German | Immigrants from Laos |
| Minimum | 0.74% | 2.0% |
| Maximum | 71.9% | 28.6% |
| Range | 71.1% | 26.6% |
| Mean | 12.1% | 11.8% |
| Median | 8.4% | 10.7% |
| Interquartile 25% (IQ1) | 7.2% | 8.4% |
| Interquartile 75% (IQ3) | 11.3% | 15.6% |
| Interquartile Range (IQR) | 4.1% | 7.2% |
| Standard Deviation (Sample) | 12.3% | 6.0% |
| Standard Deviation (Population) | 12.2% | 5.9% |
Similar Demographics by Family Poverty
Demographics Similar to Pennsylvania Germans by Family Poverty
In terms of family poverty, the demographic groups most similar to Pennsylvania Germans are Ethiopian (8.8%, a difference of 0.050%), Immigrants from Northern Africa (8.8%, a difference of 0.14%), Celtic (8.8%, a difference of 0.16%), Hungarian (8.8%, a difference of 0.18%), and Guamanian/Chamorro (8.8%, a difference of 0.19%).
| Demographics | Rating | Rank | Family Poverty |
| Immigrants | Oceania | 71.2 /100 | #156 | Good 8.7% |
| Tsimshian | 69.3 /100 | #157 | Good 8.8% |
| Whites/Caucasians | 69.1 /100 | #158 | Good 8.8% |
| Peruvians | 68.0 /100 | #159 | Good 8.8% |
| Hungarians | 67.2 /100 | #160 | Good 8.8% |
| Immigrants | Northern Africa | 66.9 /100 | #161 | Good 8.8% |
| Ethiopians | 66.3 /100 | #162 | Good 8.8% |
| Pennsylvania Germans | 66.0 /100 | #163 | Good 8.8% |
| Celtics | 64.9 /100 | #164 | Good 8.8% |
| Guamanians/Chamorros | 64.7 /100 | #165 | Good 8.8% |
| Afghans | 63.5 /100 | #166 | Good 8.8% |
| Immigrants | Ethiopia | 62.5 /100 | #167 | Good 8.9% |
| Israelis | 62.1 /100 | #168 | Good 8.9% |
| Immigrants | Chile | 59.6 /100 | #169 | Average 8.9% |
| Kenyans | 58.2 /100 | #170 | Average 8.9% |
Demographics Similar to Immigrants from Laos by Family Poverty
In terms of family poverty, the demographic groups most similar to Immigrants from Laos are Immigrants from Nigeria (10.2%, a difference of 0.26%), French American Indian (10.2%, a difference of 0.36%), Potawatomi (10.2%, a difference of 0.40%), Nigerian (10.1%, a difference of 0.51%), and Immigrants from Middle Africa (10.1%, a difference of 0.54%).
| Demographics | Rating | Rank | Family Poverty |
| Immigrants | Panama | 3.1 /100 | #230 | Tragic 10.0% |
| Alaskan Athabascans | 2.7 /100 | #231 | Tragic 10.1% |
| Immigrants | Sudan | 2.3 /100 | #232 | Tragic 10.1% |
| Fijians | 2.1 /100 | #233 | Tragic 10.1% |
| Immigrants | Middle Africa | 2.1 /100 | #234 | Tragic 10.1% |
| Nigerians | 2.0 /100 | #235 | Tragic 10.1% |
| Immigrants | Nigeria | 1.9 /100 | #236 | Tragic 10.2% |
| Immigrants | Laos | 1.7 /100 | #237 | Tragic 10.2% |
| French American Indians | 1.5 /100 | #238 | Tragic 10.2% |
| Potawatomi | 1.5 /100 | #239 | Tragic 10.2% |
| Immigrants | Azores | 1.4 /100 | #240 | Tragic 10.3% |
| Ghanaians | 1.3 /100 | #241 | Tragic 10.3% |
| Alaska Natives | 1.0 /100 | #242 | Tragic 10.4% |
| Nepalese | 0.8 /100 | #243 | Tragic 10.4% |
| Cree | 0.7 /100 | #244 | Tragic 10.5% |