Central American Indian vs German Russian Family Poverty
COMPARE
Central American Indian
German Russian
Family Poverty
Family Poverty Comparison
Central American Indians
German Russians
13.3%
FAMILY POVERTY
0.0/ 100
METRIC RATING
328th/ 347
METRIC RANK
9.4%
FAMILY POVERTY
19.4/ 100
METRIC RATING
203rd/ 347
METRIC RANK
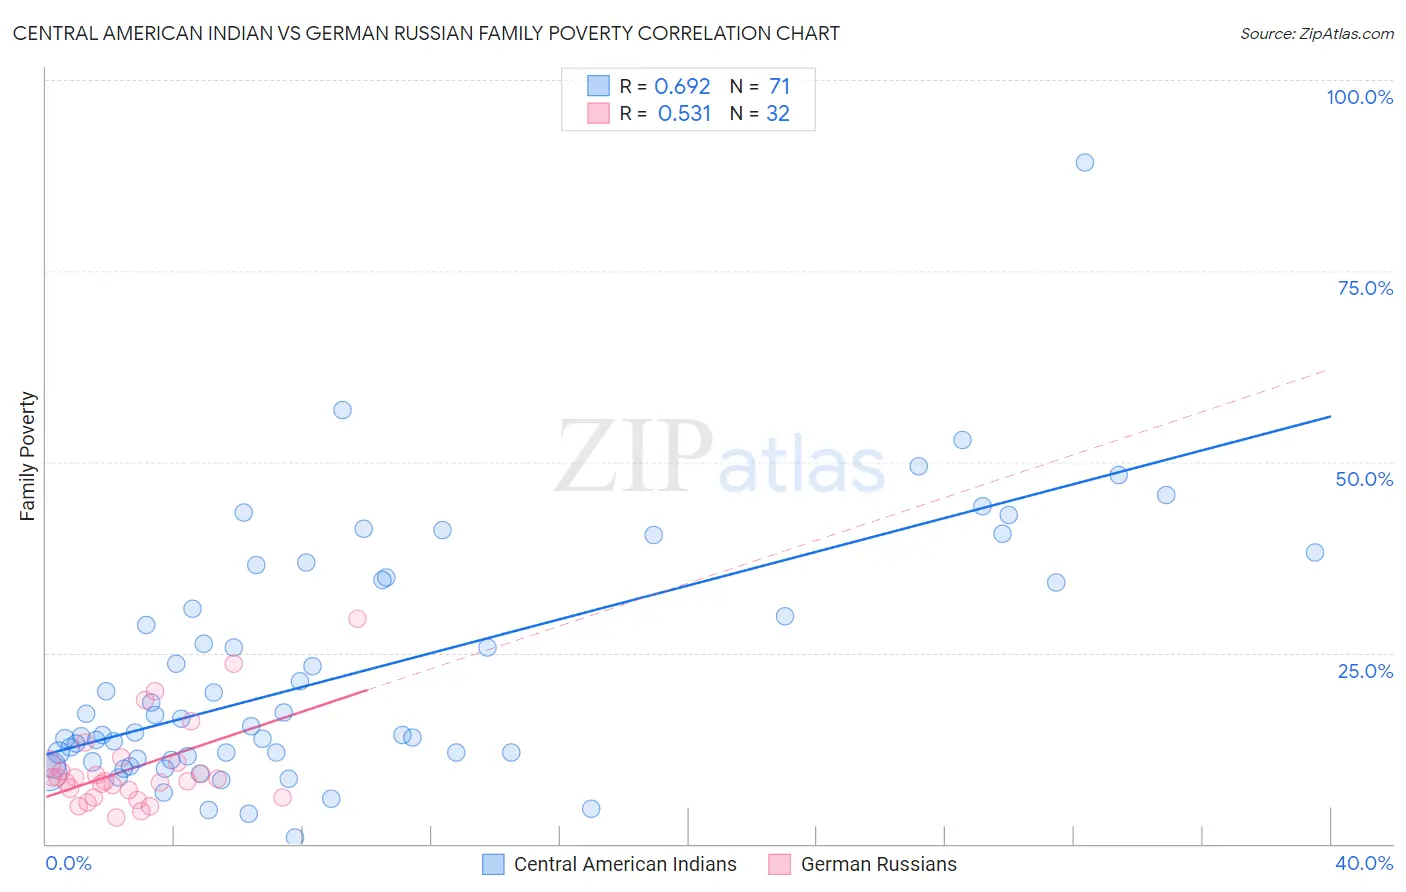
Central American Indian vs German Russian Family Poverty Correlation Chart
The statistical analysis conducted on geographies consisting of 325,737,058 people shows a significant positive correlation between the proportion of Central American Indians and poverty level among families in the United States with a correlation coefficient (R) of 0.692 and weighted average of 13.3%. Similarly, the statistical analysis conducted on geographies consisting of 96,398,519 people shows a substantial positive correlation between the proportion of German Russians and poverty level among families in the United States with a correlation coefficient (R) of 0.531 and weighted average of 9.4%, a difference of 41.2%.
Family Poverty Correlation Summary
| Measurement | Central American Indian | German Russian |
| Minimum | 0.85% | 3.4% |
| Maximum | 89.1% | 29.4% |
| Range | 88.3% | 26.0% |
| Mean | 22.4% | 10.0% |
| Median | 15.5% | 8.4% |
| Interquartile 25% (IQ1) | 11.1% | 6.5% |
| Interquartile 75% (IQ3) | 34.5% | 10.6% |
| Interquartile Range (IQR) | 23.3% | 4.1% |
| Standard Deviation (Sample) | 16.1% | 5.8% |
| Standard Deviation (Population) | 16.0% | 5.7% |
Similar Demographics by Family Poverty
Demographics Similar to Central American Indians by Family Poverty
In terms of family poverty, the demographic groups most similar to Central American Indians are Black/African American (13.3%, a difference of 0.17%), Yakama (13.1%, a difference of 1.7%), Colville (13.0%, a difference of 2.4%), Paiute (13.0%, a difference of 2.4%), and Immigrants from Dominica (12.7%, a difference of 4.4%).
| Demographics | Rating | Rank | Family Poverty |
| Arapaho | 0.0 /100 | #321 | Tragic 12.7% |
| Immigrants | Honduras | 0.0 /100 | #322 | Tragic 12.7% |
| Menominee | 0.0 /100 | #323 | Tragic 12.7% |
| Immigrants | Dominica | 0.0 /100 | #324 | Tragic 12.7% |
| Paiute | 0.0 /100 | #325 | Tragic 13.0% |
| Colville | 0.0 /100 | #326 | Tragic 13.0% |
| Yakama | 0.0 /100 | #327 | Tragic 13.1% |
| Central American Indians | 0.0 /100 | #328 | Tragic 13.3% |
| Blacks/African Americans | 0.0 /100 | #329 | Tragic 13.3% |
| Natives/Alaskans | 0.0 /100 | #330 | Tragic 14.3% |
| Cheyenne | 0.0 /100 | #331 | Tragic 14.3% |
| Dominicans | 0.0 /100 | #332 | Tragic 14.3% |
| Immigrants | Dominican Republic | 0.0 /100 | #333 | Tragic 14.4% |
| Houma | 0.0 /100 | #334 | Tragic 14.6% |
| Apache | 0.0 /100 | #335 | Tragic 14.7% |
Demographics Similar to German Russians by Family Poverty
In terms of family poverty, the demographic groups most similar to German Russians are Immigrants from Sierra Leone (9.4%, a difference of 0.040%), Immigrants from Lebanon (9.4%, a difference of 0.10%), Immigrants from Portugal (9.4%, a difference of 0.21%), Aleut (9.5%, a difference of 0.29%), and Immigrants from South America (9.5%, a difference of 0.30%).
| Demographics | Rating | Rank | Family Poverty |
| Immigrants | Venezuela | 26.1 /100 | #196 | Fair 9.3% |
| Immigrants | Colombia | 24.4 /100 | #197 | Fair 9.3% |
| Iraqis | 24.2 /100 | #198 | Fair 9.3% |
| Spaniards | 22.8 /100 | #199 | Fair 9.4% |
| Immigrants | Costa Rica | 21.7 /100 | #200 | Fair 9.4% |
| Immigrants | Portugal | 20.5 /100 | #201 | Fair 9.4% |
| Immigrants | Sierra Leone | 19.6 /100 | #202 | Poor 9.4% |
| German Russians | 19.4 /100 | #203 | Poor 9.4% |
| Immigrants | Lebanon | 18.9 /100 | #204 | Poor 9.4% |
| Aleuts | 18.0 /100 | #205 | Poor 9.5% |
| Immigrants | South America | 18.0 /100 | #206 | Poor 9.5% |
| Sierra Leoneans | 15.6 /100 | #207 | Poor 9.5% |
| Immigrants | Eastern Africa | 15.1 /100 | #208 | Poor 9.5% |
| Immigrants | Uruguay | 14.0 /100 | #209 | Poor 9.5% |
| Alsatians | 11.3 /100 | #210 | Poor 9.6% |