Pennsylvania German vs German Russian Births to Unmarried Women
COMPARE
Pennsylvania German
German Russian
Births to Unmarried Women
Births to Unmarried Women Comparison
Pennsylvania Germans
German Russians
34.0%
BIRTHS TO UNMARRIED WOMEN
4.3/ 100
METRIC RATING
223rd/ 347
METRIC RANK
33.1%
BIRTHS TO UNMARRIED WOMEN
13.1/ 100
METRIC RATING
205th/ 347
METRIC RANK
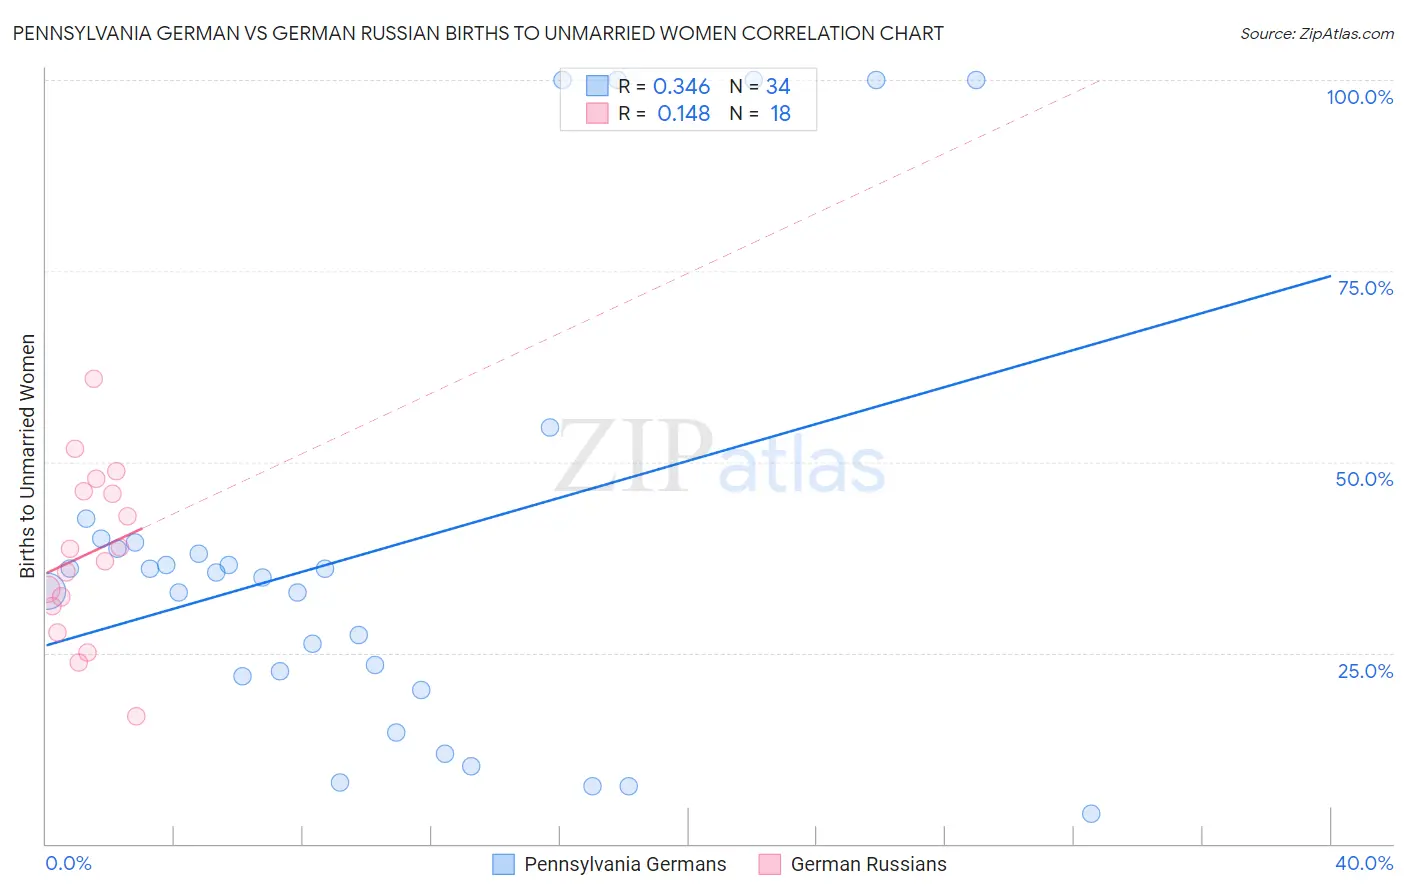
Pennsylvania German vs German Russian Births to Unmarried Women Correlation Chart
The statistical analysis conducted on geographies consisting of 220,469,063 people shows a mild positive correlation between the proportion of Pennsylvania Germans and percentage of births to unmarried women in the United States with a correlation coefficient (R) of 0.346 and weighted average of 34.0%. Similarly, the statistical analysis conducted on geographies consisting of 94,648,089 people shows a poor positive correlation between the proportion of German Russians and percentage of births to unmarried women in the United States with a correlation coefficient (R) of 0.148 and weighted average of 33.1%, a difference of 2.8%.
Births to Unmarried Women Correlation Summary
| Measurement | Pennsylvania German | German Russian |
| Minimum | 4.0% | 16.7% |
| Maximum | 100.0% | 60.9% |
| Range | 96.0% | 44.2% |
| Mean | 38.5% | 38.0% |
| Median | 35.2% | 37.8% |
| Interquartile 25% (IQ1) | 21.9% | 31.1% |
| Interquartile 75% (IQ3) | 39.5% | 46.1% |
| Interquartile Range (IQR) | 17.6% | 15.1% |
| Standard Deviation (Sample) | 28.5% | 11.2% |
| Standard Deviation (Population) | 28.1% | 10.8% |
Demographics Similar to Pennsylvania Germans and German Russians by Births to Unmarried Women
In terms of births to unmarried women, the demographic groups most similar to Pennsylvania Germans are Immigrants from Laos (34.0%, a difference of 0.0%), Immigrants from Uruguay (33.9%, a difference of 0.29%), Malaysian (33.9%, a difference of 0.35%), Portuguese (33.8%, a difference of 0.53%), and Alsatian (33.8%, a difference of 0.55%). Similarly, the demographic groups most similar to German Russians are Uruguayan (33.1%, a difference of 0.060%), Immigrants from Africa (33.0%, a difference of 0.23%), Immigrants from Sudan (33.2%, a difference of 0.34%), Hawaiian (33.2%, a difference of 0.38%), and White/Caucasian (33.3%, a difference of 0.51%).
| Demographics | Rating | Rank | Births to Unmarried Women |
| Immigrants | Africa | 14.3 /100 | #204 | Poor 33.0% |
| German Russians | 13.1 /100 | #205 | Poor 33.1% |
| Uruguayans | 12.8 /100 | #206 | Poor 33.1% |
| Immigrants | Sudan | 11.5 /100 | #207 | Poor 33.2% |
| Hawaiians | 11.3 /100 | #208 | Poor 33.2% |
| Whites/Caucasians | 10.7 /100 | #209 | Poor 33.3% |
| Scotch-Irish | 10.7 /100 | #210 | Poor 33.3% |
| Ecuadorians | 10.5 /100 | #211 | Poor 33.3% |
| Celtics | 10.2 /100 | #212 | Poor 33.3% |
| Immigrants | Costa Rica | 9.5 /100 | #213 | Tragic 33.4% |
| Slovaks | 9.3 /100 | #214 | Tragic 33.4% |
| French | 8.7 /100 | #215 | Tragic 33.4% |
| Nepalese | 7.8 /100 | #216 | Tragic 33.5% |
| Spaniards | 7.0 /100 | #217 | Tragic 33.6% |
| Immigrants | Ecuador | 5.9 /100 | #218 | Tragic 33.7% |
| Alsatians | 5.4 /100 | #219 | Tragic 33.8% |
| Portuguese | 5.4 /100 | #220 | Tragic 33.8% |
| Malaysians | 5.0 /100 | #221 | Tragic 33.9% |
| Immigrants | Uruguay | 4.8 /100 | #222 | Tragic 33.9% |
| Pennsylvania Germans | 4.3 /100 | #223 | Tragic 34.0% |
| Immigrants | Laos | 4.3 /100 | #224 | Tragic 34.0% |