Moroccan vs German Russian Family Poverty
COMPARE
Moroccan
German Russian
Family Poverty
Family Poverty Comparison
Moroccans
German Russians
9.8%
FAMILY POVERTY
6.5/ 100
METRIC RATING
216th/ 347
METRIC RANK
9.4%
FAMILY POVERTY
19.4/ 100
METRIC RATING
203rd/ 347
METRIC RANK
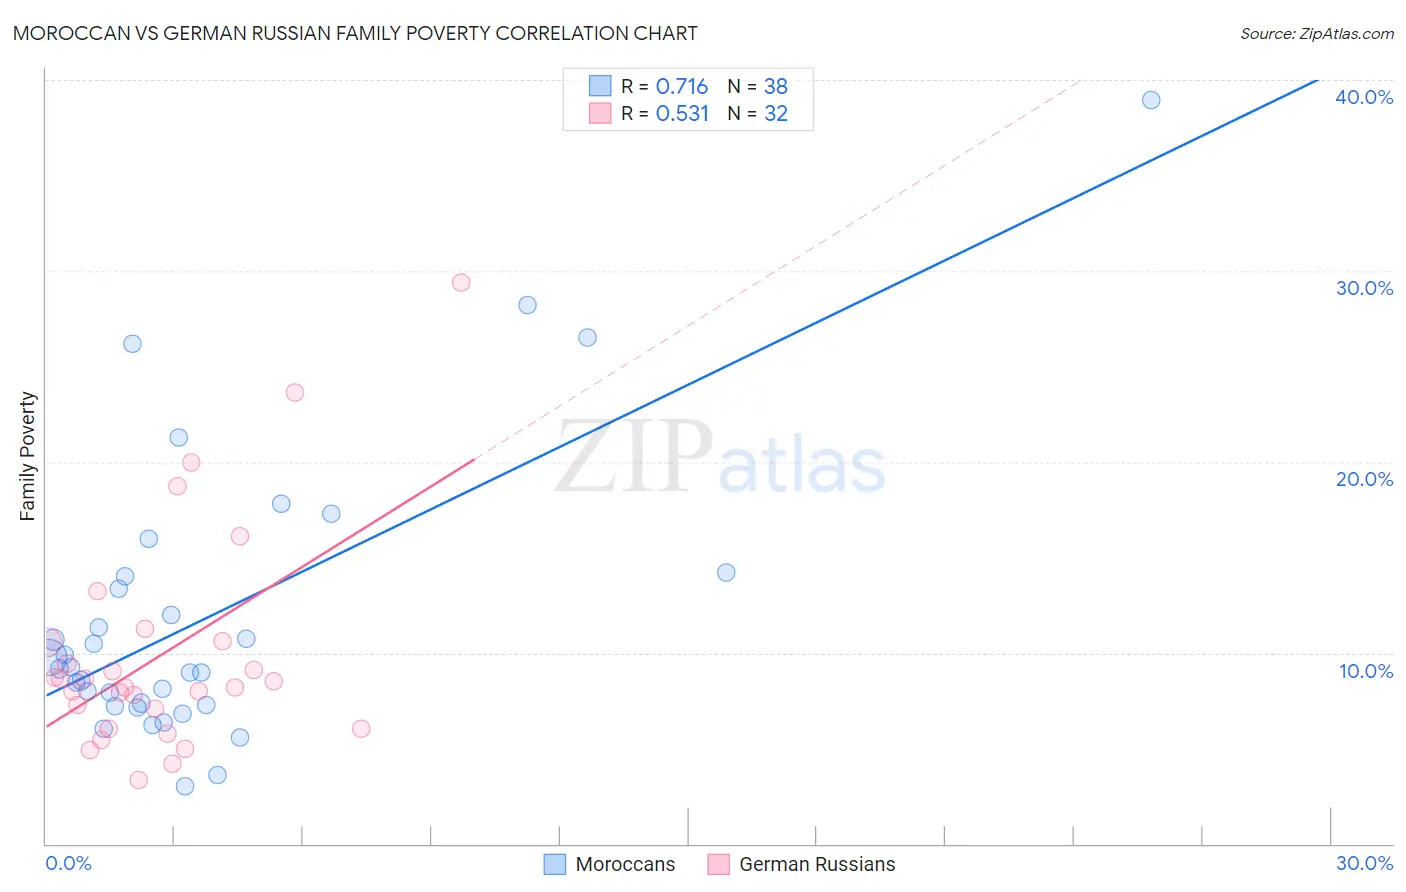
Moroccan vs German Russian Family Poverty Correlation Chart
The statistical analysis conducted on geographies consisting of 201,527,529 people shows a strong positive correlation between the proportion of Moroccans and poverty level among families in the United States with a correlation coefficient (R) of 0.716 and weighted average of 9.8%. Similarly, the statistical analysis conducted on geographies consisting of 96,398,519 people shows a substantial positive correlation between the proportion of German Russians and poverty level among families in the United States with a correlation coefficient (R) of 0.531 and weighted average of 9.4%, a difference of 3.9%.
Family Poverty Correlation Summary
| Measurement | Moroccan | German Russian |
| Minimum | 3.0% | 3.4% |
| Maximum | 39.0% | 29.4% |
| Range | 36.0% | 26.0% |
| Mean | 11.9% | 10.0% |
| Median | 9.2% | 8.4% |
| Interquartile 25% (IQ1) | 7.2% | 6.5% |
| Interquartile 75% (IQ3) | 14.0% | 10.6% |
| Interquartile Range (IQR) | 6.7% | 4.1% |
| Standard Deviation (Sample) | 7.6% | 5.8% |
| Standard Deviation (Population) | 7.5% | 5.7% |
Demographics Similar to Moroccans and German Russians by Family Poverty
In terms of family poverty, the demographic groups most similar to Moroccans are Nonimmigrants (9.8%, a difference of 0.060%), Immigrants from Micronesia (9.8%, a difference of 0.090%), American (9.8%, a difference of 0.20%), Panamanian (9.8%, a difference of 0.52%), and Immigrants from Eritrea (9.9%, a difference of 0.64%). Similarly, the demographic groups most similar to German Russians are Immigrants from Sierra Leone (9.4%, a difference of 0.040%), Immigrants from Lebanon (9.4%, a difference of 0.10%), Immigrants from Portugal (9.4%, a difference of 0.21%), Aleut (9.5%, a difference of 0.29%), and Immigrants from South America (9.5%, a difference of 0.30%).
| Demographics | Rating | Rank | Family Poverty |
| Spaniards | 22.8 /100 | #199 | Fair 9.4% |
| Immigrants | Costa Rica | 21.7 /100 | #200 | Fair 9.4% |
| Immigrants | Portugal | 20.5 /100 | #201 | Fair 9.4% |
| Immigrants | Sierra Leone | 19.6 /100 | #202 | Poor 9.4% |
| German Russians | 19.4 /100 | #203 | Poor 9.4% |
| Immigrants | Lebanon | 18.9 /100 | #204 | Poor 9.4% |
| Aleuts | 18.0 /100 | #205 | Poor 9.5% |
| Immigrants | South America | 18.0 /100 | #206 | Poor 9.5% |
| Sierra Leoneans | 15.6 /100 | #207 | Poor 9.5% |
| Immigrants | Eastern Africa | 15.1 /100 | #208 | Poor 9.5% |
| Immigrants | Uruguay | 14.0 /100 | #209 | Poor 9.5% |
| Alsatians | 11.3 /100 | #210 | Poor 9.6% |
| Malaysians | 10.6 /100 | #211 | Poor 9.6% |
| Immigrants | Thailand | 9.7 /100 | #212 | Tragic 9.7% |
| Osage | 8.0 /100 | #213 | Tragic 9.7% |
| Immigrants | Micronesia | 6.7 /100 | #214 | Tragic 9.8% |
| Immigrants | Nonimmigrants | 6.7 /100 | #215 | Tragic 9.8% |
| Moroccans | 6.5 /100 | #216 | Tragic 9.8% |
| Americans | 6.2 /100 | #217 | Tragic 9.8% |
| Panamanians | 5.6 /100 | #218 | Tragic 9.8% |
| Immigrants | Eritrea | 5.4 /100 | #219 | Tragic 9.9% |