Pennsylvania German vs Choctaw Family Poverty
COMPARE
Pennsylvania German
Choctaw
Family Poverty
Family Poverty Comparison
Pennsylvania Germans
Choctaw
8.8%
FAMILY POVERTY
66.0/ 100
METRIC RATING
163rd/ 347
METRIC RANK
11.6%
FAMILY POVERTY
0.0/ 100
METRIC RATING
296th/ 347
METRIC RANK
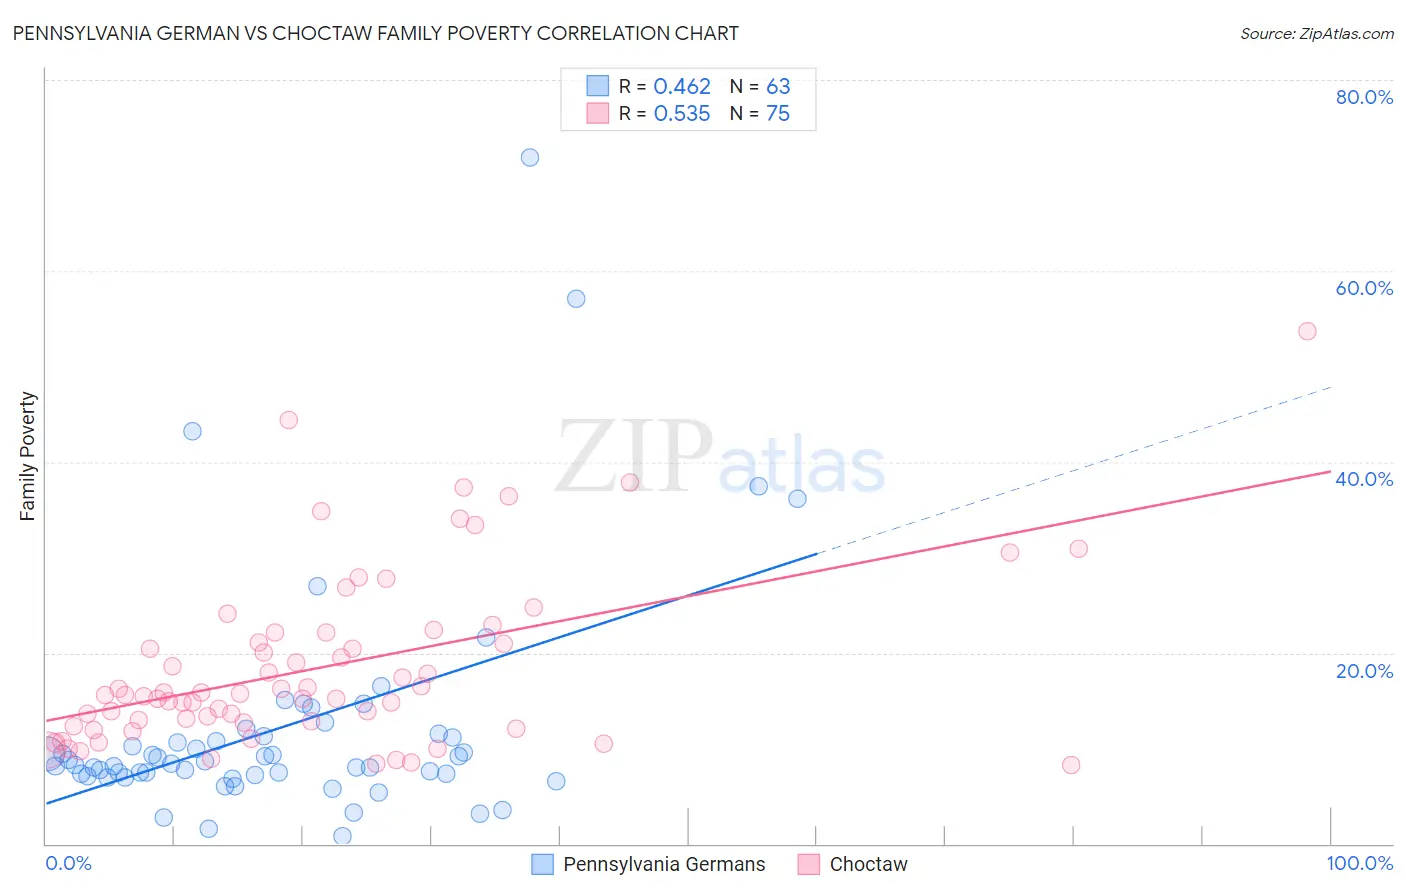
Pennsylvania German vs Choctaw Family Poverty Correlation Chart
The statistical analysis conducted on geographies consisting of 233,657,746 people shows a moderate positive correlation between the proportion of Pennsylvania Germans and poverty level among families in the United States with a correlation coefficient (R) of 0.462 and weighted average of 8.8%. Similarly, the statistical analysis conducted on geographies consisting of 269,406,006 people shows a substantial positive correlation between the proportion of Choctaw and poverty level among families in the United States with a correlation coefficient (R) of 0.535 and weighted average of 11.6%, a difference of 31.9%.
Family Poverty Correlation Summary
| Measurement | Pennsylvania German | Choctaw |
| Minimum | 0.74% | 8.2% |
| Maximum | 71.9% | 53.6% |
| Range | 71.1% | 45.4% |
| Mean | 12.1% | 18.5% |
| Median | 8.4% | 15.6% |
| Interquartile 25% (IQ1) | 7.2% | 12.7% |
| Interquartile 75% (IQ3) | 11.3% | 22.1% |
| Interquartile Range (IQR) | 4.1% | 9.3% |
| Standard Deviation (Sample) | 12.3% | 9.0% |
| Standard Deviation (Population) | 12.2% | 9.0% |
Similar Demographics by Family Poverty
Demographics Similar to Pennsylvania Germans by Family Poverty
In terms of family poverty, the demographic groups most similar to Pennsylvania Germans are Ethiopian (8.8%, a difference of 0.050%), Immigrants from Northern Africa (8.8%, a difference of 0.14%), Celtic (8.8%, a difference of 0.16%), Hungarian (8.8%, a difference of 0.18%), and Guamanian/Chamorro (8.8%, a difference of 0.19%).
| Demographics | Rating | Rank | Family Poverty |
| Immigrants | Oceania | 71.2 /100 | #156 | Good 8.7% |
| Tsimshian | 69.3 /100 | #157 | Good 8.8% |
| Whites/Caucasians | 69.1 /100 | #158 | Good 8.8% |
| Peruvians | 68.0 /100 | #159 | Good 8.8% |
| Hungarians | 67.2 /100 | #160 | Good 8.8% |
| Immigrants | Northern Africa | 66.9 /100 | #161 | Good 8.8% |
| Ethiopians | 66.3 /100 | #162 | Good 8.8% |
| Pennsylvania Germans | 66.0 /100 | #163 | Good 8.8% |
| Celtics | 64.9 /100 | #164 | Good 8.8% |
| Guamanians/Chamorros | 64.7 /100 | #165 | Good 8.8% |
| Afghans | 63.5 /100 | #166 | Good 8.8% |
| Immigrants | Ethiopia | 62.5 /100 | #167 | Good 8.9% |
| Israelis | 62.1 /100 | #168 | Good 8.9% |
| Immigrants | Chile | 59.6 /100 | #169 | Average 8.9% |
| Kenyans | 58.2 /100 | #170 | Average 8.9% |
Demographics Similar to Choctaw by Family Poverty
In terms of family poverty, the demographic groups most similar to Choctaw are Immigrants from Haiti (11.6%, a difference of 0.050%), Immigrants from St. Vincent and the Grenadines (11.6%, a difference of 0.17%), Creek (11.7%, a difference of 0.23%), Immigrants from Cabo Verde (11.6%, a difference of 0.25%), and Immigrants from Senegal (11.7%, a difference of 0.37%).
| Demographics | Rating | Rank | Family Poverty |
| Immigrants | Barbados | 0.0 /100 | #289 | Tragic 11.5% |
| West Indians | 0.0 /100 | #290 | Tragic 11.5% |
| Haitians | 0.0 /100 | #291 | Tragic 11.5% |
| Immigrants | Somalia | 0.0 /100 | #292 | Tragic 11.5% |
| Immigrants | Cabo Verde | 0.0 /100 | #293 | Tragic 11.6% |
| Immigrants | St. Vincent and the Grenadines | 0.0 /100 | #294 | Tragic 11.6% |
| Immigrants | Haiti | 0.0 /100 | #295 | Tragic 11.6% |
| Choctaw | 0.0 /100 | #296 | Tragic 11.6% |
| Creek | 0.0 /100 | #297 | Tragic 11.7% |
| Immigrants | Senegal | 0.0 /100 | #298 | Tragic 11.7% |
| Dutch West Indians | 0.0 /100 | #299 | Tragic 11.7% |
| Immigrants | Bangladesh | 0.0 /100 | #300 | Tragic 11.7% |
| Bahamians | 0.0 /100 | #301 | Tragic 11.7% |
| Guatemalans | 0.0 /100 | #302 | Tragic 11.7% |
| Africans | 0.0 /100 | #303 | Tragic 11.8% |