Pennsylvania German vs Arapaho Single Female Poverty
COMPARE
Pennsylvania German
Arapaho
Single Female Poverty
Single Female Poverty Comparison
Pennsylvania Germans
Arapaho
23.6%
SINGLE FEMALE POVERTY
0.0/ 100
METRIC RATING
277th/ 347
METRIC RANK
26.4%
SINGLE FEMALE POVERTY
0.0/ 100
METRIC RATING
320th/ 347
METRIC RANK
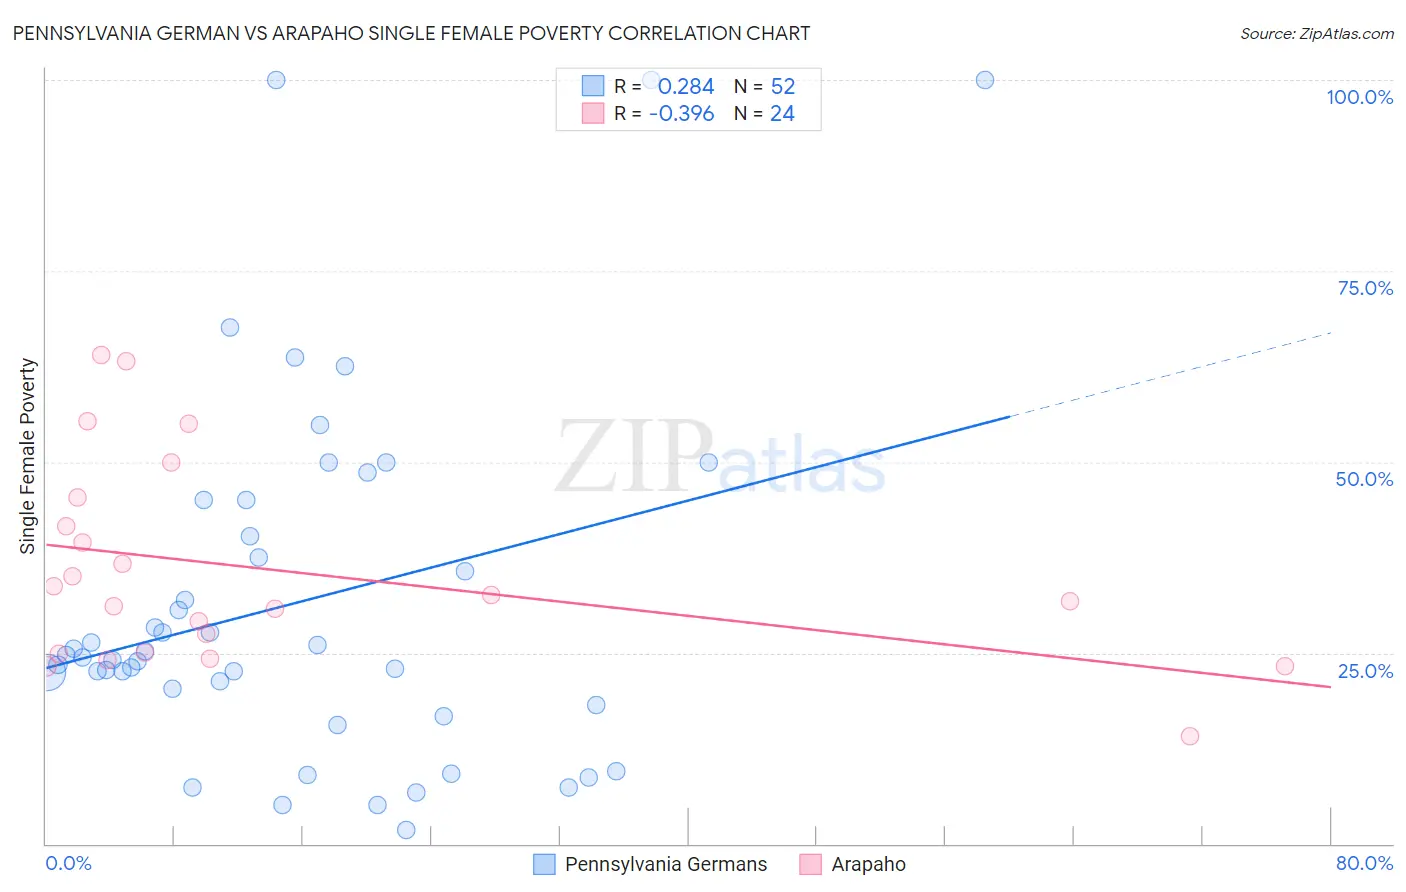
Pennsylvania German vs Arapaho Single Female Poverty Correlation Chart
The statistical analysis conducted on geographies consisting of 231,066,228 people shows a weak positive correlation between the proportion of Pennsylvania Germans and poverty level among single females in the United States with a correlation coefficient (R) of 0.284 and weighted average of 23.6%. Similarly, the statistical analysis conducted on geographies consisting of 29,687,271 people shows a mild negative correlation between the proportion of Arapaho and poverty level among single females in the United States with a correlation coefficient (R) of -0.396 and weighted average of 26.4%, a difference of 12.1%.
Single Female Poverty Correlation Summary
| Measurement | Pennsylvania German | Arapaho |
| Minimum | 1.8% | 14.1% |
| Maximum | 100.0% | 63.9% |
| Range | 98.2% | 49.8% |
| Mean | 31.6% | 35.9% |
| Median | 24.5% | 32.1% |
| Interquartile 25% (IQ1) | 19.2% | 25.0% |
| Interquartile 75% (IQ3) | 42.6% | 43.4% |
| Interquartile Range (IQR) | 23.4% | 18.5% |
| Standard Deviation (Sample) | 23.3% | 13.4% |
| Standard Deviation (Population) | 23.1% | 13.1% |
Similar Demographics by Single Female Poverty
Demographics Similar to Pennsylvania Germans by Single Female Poverty
In terms of single female poverty, the demographic groups most similar to Pennsylvania Germans are Nonimmigrants (23.6%, a difference of 0.080%), Alaskan Athabascan (23.6%, a difference of 0.11%), Immigrants from the Azores (23.5%, a difference of 0.15%), Immigrants from Latin America (23.7%, a difference of 0.60%), and Mexican American Indian (23.4%, a difference of 0.94%).
| Demographics | Rating | Rank | Single Female Poverty |
| Inupiat | 0.2 /100 | #270 | Tragic 23.1% |
| Sub-Saharan Africans | 0.1 /100 | #271 | Tragic 23.2% |
| Immigrants | Senegal | 0.1 /100 | #272 | Tragic 23.2% |
| Alaska Natives | 0.1 /100 | #273 | Tragic 23.3% |
| Marshallese | 0.1 /100 | #274 | Tragic 23.3% |
| Mexican American Indians | 0.1 /100 | #275 | Tragic 23.4% |
| Immigrants | Azores | 0.0 /100 | #276 | Tragic 23.5% |
| Pennsylvania Germans | 0.0 /100 | #277 | Tragic 23.6% |
| Immigrants | Nonimmigrants | 0.0 /100 | #278 | Tragic 23.6% |
| Alaskan Athabascans | 0.0 /100 | #279 | Tragic 23.6% |
| Immigrants | Latin America | 0.0 /100 | #280 | Tragic 23.7% |
| Immigrants | Zaire | 0.0 /100 | #281 | Tragic 23.8% |
| Guatemalans | 0.0 /100 | #282 | Tragic 23.8% |
| German Russians | 0.0 /100 | #283 | Tragic 23.9% |
| Immigrants | Dominica | 0.0 /100 | #284 | Tragic 23.9% |
Demographics Similar to Arapaho by Single Female Poverty
In terms of single female poverty, the demographic groups most similar to Arapaho are Black/African American (26.4%, a difference of 0.30%), Chickasaw (26.3%, a difference of 0.63%), Yup'ik (26.6%, a difference of 0.64%), Seminole (26.8%, a difference of 1.4%), and Chippewa (26.8%, a difference of 1.5%).
| Demographics | Rating | Rank | Single Female Poverty |
| Comanche | 0.0 /100 | #313 | Tragic 25.6% |
| Cherokee | 0.0 /100 | #314 | Tragic 25.7% |
| Iroquois | 0.0 /100 | #315 | Tragic 25.7% |
| Immigrants | Somalia | 0.0 /100 | #316 | Tragic 25.8% |
| Ottawa | 0.0 /100 | #317 | Tragic 26.0% |
| Chickasaw | 0.0 /100 | #318 | Tragic 26.3% |
| Blacks/African Americans | 0.0 /100 | #319 | Tragic 26.4% |
| Arapaho | 0.0 /100 | #320 | Tragic 26.4% |
| Yup'ik | 0.0 /100 | #321 | Tragic 26.6% |
| Seminole | 0.0 /100 | #322 | Tragic 26.8% |
| Chippewa | 0.0 /100 | #323 | Tragic 26.8% |
| Kiowa | 0.0 /100 | #324 | Tragic 26.9% |
| Choctaw | 0.0 /100 | #325 | Tragic 27.2% |
| Creek | 0.0 /100 | #326 | Tragic 27.4% |
| Dutch West Indians | 0.0 /100 | #327 | Tragic 27.5% |