Bolivian vs Arapaho Single Female Poverty
COMPARE
Bolivian
Arapaho
Single Female Poverty
Single Female Poverty Comparison
Bolivians
Arapaho
17.9%
SINGLE FEMALE POVERTY
100.0/ 100
METRIC RATING
14th/ 347
METRIC RANK
26.4%
SINGLE FEMALE POVERTY
0.0/ 100
METRIC RATING
320th/ 347
METRIC RANK
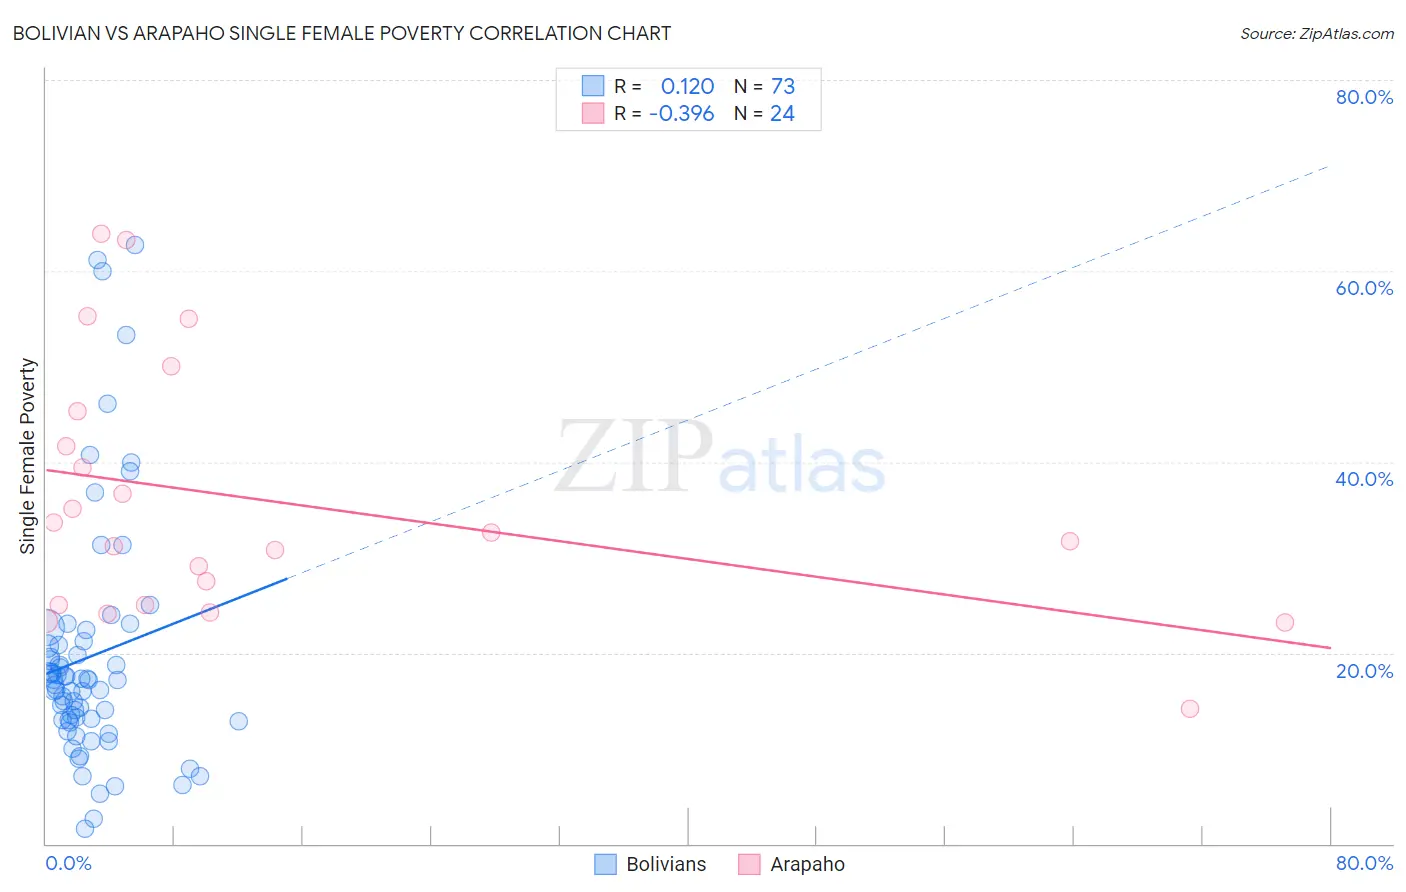
Bolivian vs Arapaho Single Female Poverty Correlation Chart
The statistical analysis conducted on geographies consisting of 183,445,495 people shows a poor positive correlation between the proportion of Bolivians and poverty level among single females in the United States with a correlation coefficient (R) of 0.120 and weighted average of 17.9%. Similarly, the statistical analysis conducted on geographies consisting of 29,687,271 people shows a mild negative correlation between the proportion of Arapaho and poverty level among single females in the United States with a correlation coefficient (R) of -0.396 and weighted average of 26.4%, a difference of 47.5%.
Single Female Poverty Correlation Summary
| Measurement | Bolivian | Arapaho |
| Minimum | 1.6% | 14.1% |
| Maximum | 62.7% | 63.9% |
| Range | 61.1% | 49.8% |
| Mean | 19.6% | 35.9% |
| Median | 17.1% | 32.1% |
| Interquartile 25% (IQ1) | 12.9% | 25.0% |
| Interquartile 75% (IQ3) | 21.0% | 43.4% |
| Interquartile Range (IQR) | 8.1% | 18.5% |
| Standard Deviation (Sample) | 12.8% | 13.4% |
| Standard Deviation (Population) | 12.7% | 13.1% |
Similar Demographics by Single Female Poverty
Demographics Similar to Bolivians by Single Female Poverty
In terms of single female poverty, the demographic groups most similar to Bolivians are Indian (Asian) (17.9%, a difference of 0.15%), Iranian (18.0%, a difference of 0.30%), Immigrants from Bolivia (17.8%, a difference of 0.44%), Immigrants from South Central Asia (17.8%, a difference of 0.70%), and Immigrants from Lithuania (17.8%, a difference of 0.76%).
| Demographics | Rating | Rank | Single Female Poverty |
| Thais | 100.0 /100 | #7 | Exceptional 17.3% |
| Immigrants | Iran | 100.0 /100 | #8 | Exceptional 17.5% |
| Bhutanese | 100.0 /100 | #9 | Exceptional 17.7% |
| Immigrants | Ireland | 100.0 /100 | #10 | Exceptional 17.8% |
| Immigrants | Lithuania | 100.0 /100 | #11 | Exceptional 17.8% |
| Immigrants | South Central Asia | 100.0 /100 | #12 | Exceptional 17.8% |
| Immigrants | Bolivia | 100.0 /100 | #13 | Exceptional 17.8% |
| Bolivians | 100.0 /100 | #14 | Exceptional 17.9% |
| Indians (Asian) | 100.0 /100 | #15 | Exceptional 17.9% |
| Iranians | 100.0 /100 | #16 | Exceptional 18.0% |
| Immigrants | Korea | 100.0 /100 | #17 | Exceptional 18.1% |
| Immigrants | Eastern Asia | 100.0 /100 | #18 | Exceptional 18.1% |
| Immigrants | China | 100.0 /100 | #19 | Exceptional 18.1% |
| Immigrants | Greece | 100.0 /100 | #20 | Exceptional 18.3% |
| Maltese | 100.0 /100 | #21 | Exceptional 18.3% |
Demographics Similar to Arapaho by Single Female Poverty
In terms of single female poverty, the demographic groups most similar to Arapaho are Black/African American (26.4%, a difference of 0.30%), Chickasaw (26.3%, a difference of 0.63%), Yup'ik (26.6%, a difference of 0.64%), Seminole (26.8%, a difference of 1.4%), and Chippewa (26.8%, a difference of 1.5%).
| Demographics | Rating | Rank | Single Female Poverty |
| Comanche | 0.0 /100 | #313 | Tragic 25.6% |
| Cherokee | 0.0 /100 | #314 | Tragic 25.7% |
| Iroquois | 0.0 /100 | #315 | Tragic 25.7% |
| Immigrants | Somalia | 0.0 /100 | #316 | Tragic 25.8% |
| Ottawa | 0.0 /100 | #317 | Tragic 26.0% |
| Chickasaw | 0.0 /100 | #318 | Tragic 26.3% |
| Blacks/African Americans | 0.0 /100 | #319 | Tragic 26.4% |
| Arapaho | 0.0 /100 | #320 | Tragic 26.4% |
| Yup'ik | 0.0 /100 | #321 | Tragic 26.6% |
| Seminole | 0.0 /100 | #322 | Tragic 26.8% |
| Chippewa | 0.0 /100 | #323 | Tragic 26.8% |
| Kiowa | 0.0 /100 | #324 | Tragic 26.9% |
| Choctaw | 0.0 /100 | #325 | Tragic 27.2% |
| Creek | 0.0 /100 | #326 | Tragic 27.4% |
| Dutch West Indians | 0.0 /100 | #327 | Tragic 27.5% |