Paraguayan vs Immigrants from Lebanon Married-Couple Family Poverty
COMPARE
Paraguayan
Immigrants from Lebanon
Married-Couple Family Poverty
Married-Couple Family Poverty Comparison
Paraguayans
Immigrants from Lebanon
5.1%
MARRIED-COUPLE FAMILY POVERTY
61.5/ 100
METRIC RATING
166th/ 347
METRIC RANK
6.6%
MARRIED-COUPLE FAMILY POVERTY
0.0/ 100
METRIC RATING
292nd/ 347
METRIC RANK
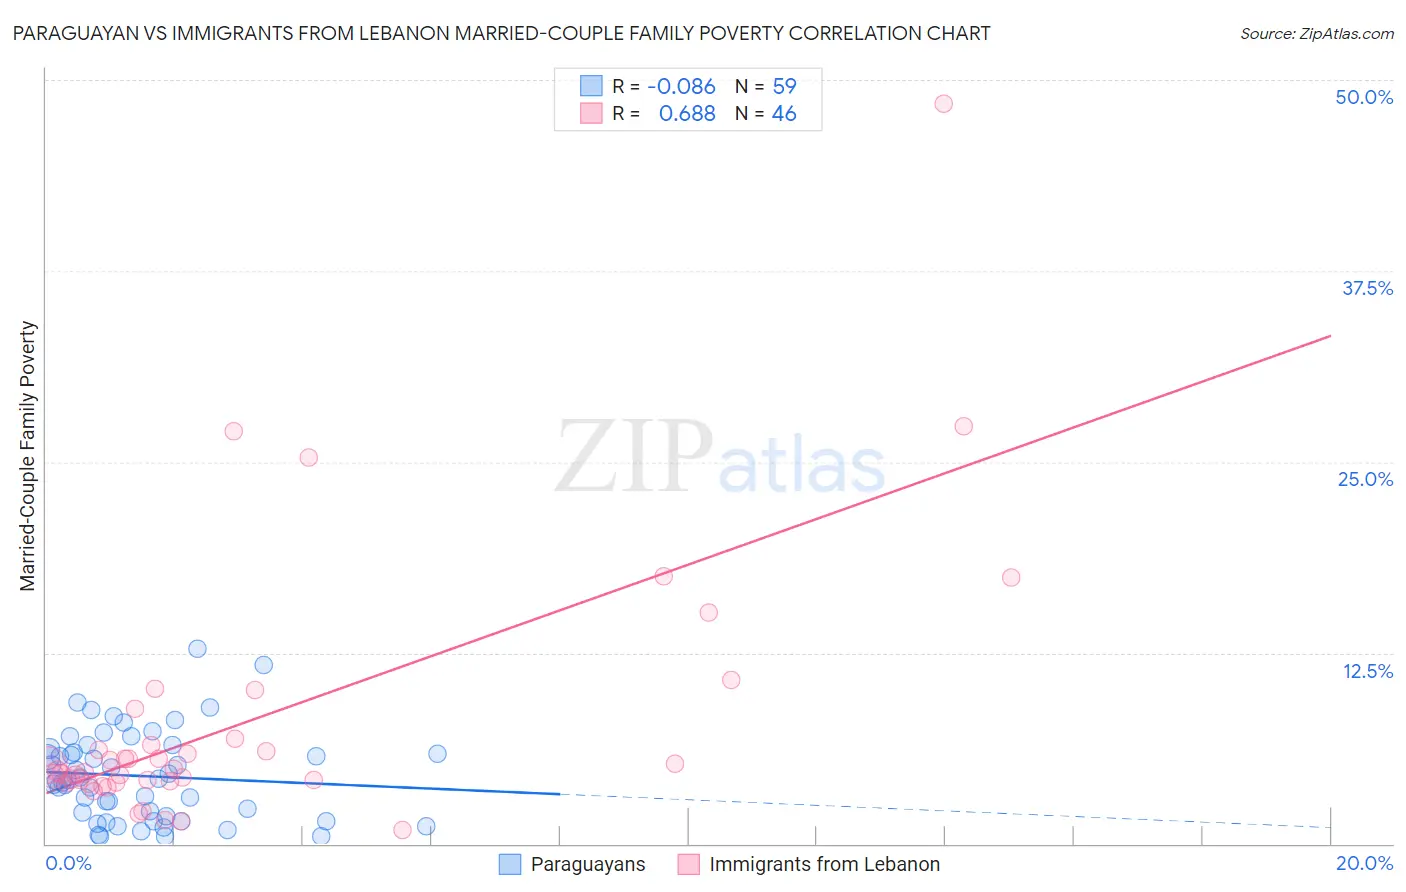
Paraguayan vs Immigrants from Lebanon Married-Couple Family Poverty Correlation Chart
The statistical analysis conducted on geographies consisting of 94,718,815 people shows a slight negative correlation between the proportion of Paraguayans and poverty level among married-couple families in the United States with a correlation coefficient (R) of -0.086 and weighted average of 5.1%. Similarly, the statistical analysis conducted on geographies consisting of 216,189,753 people shows a significant positive correlation between the proportion of Immigrants from Lebanon and poverty level among married-couple families in the United States with a correlation coefficient (R) of 0.688 and weighted average of 6.6%, a difference of 27.5%.
Married-Couple Family Poverty Correlation Summary
| Measurement | Paraguayan | Immigrants from Lebanon |
| Minimum | 0.45% | 0.93% |
| Maximum | 12.8% | 48.5% |
| Range | 12.3% | 47.6% |
| Mean | 4.4% | 8.0% |
| Median | 4.2% | 4.8% |
| Interquartile 25% (IQ1) | 1.8% | 4.1% |
| Interquartile 75% (IQ3) | 6.2% | 6.8% |
| Interquartile Range (IQR) | 4.4% | 2.8% |
| Standard Deviation (Sample) | 2.9% | 8.8% |
| Standard Deviation (Population) | 2.9% | 8.7% |
Similar Demographics by Married-Couple Family Poverty
Demographics Similar to Paraguayans by Married-Couple Family Poverty
In terms of married-couple family poverty, the demographic groups most similar to Paraguayans are Costa Rican (5.1%, a difference of 0.0%), Immigrants from Malaysia (5.1%, a difference of 0.090%), Hawaiian (5.1%, a difference of 0.10%), Sierra Leonean (5.1%, a difference of 0.34%), and Immigrants from Jordan (5.1%, a difference of 0.65%).
| Demographics | Rating | Rank | Married-Couple Family Poverty |
| Immigrants | Saudi Arabia | 70.3 /100 | #159 | Good 5.1% |
| Pennsylvania Germans | 68.5 /100 | #160 | Good 5.1% |
| Ethiopians | 68.1 /100 | #161 | Good 5.1% |
| Immigrants | Jordan | 66.5 /100 | #162 | Good 5.1% |
| Sierra Leoneans | 64.1 /100 | #163 | Good 5.1% |
| Hawaiians | 62.3 /100 | #164 | Good 5.1% |
| Immigrants | Malaysia | 62.2 /100 | #165 | Good 5.1% |
| Paraguayans | 61.5 /100 | #166 | Good 5.1% |
| Costa Ricans | 61.5 /100 | #167 | Good 5.1% |
| Immigrants | Uganda | 54.9 /100 | #168 | Average 5.2% |
| Ottawa | 54.5 /100 | #169 | Average 5.2% |
| Immigrants | Argentina | 54.4 /100 | #170 | Average 5.2% |
| Bermudans | 52.9 /100 | #171 | Average 5.2% |
| Immigrants | Northern Africa | 51.3 /100 | #172 | Average 5.2% |
| Alsatians | 51.2 /100 | #173 | Average 5.2% |
Demographics Similar to Immigrants from Lebanon by Married-Couple Family Poverty
In terms of married-couple family poverty, the demographic groups most similar to Immigrants from Lebanon are Arapaho (6.6%, a difference of 0.080%), Belizean (6.5%, a difference of 0.17%), Immigrants from Barbados (6.5%, a difference of 0.21%), Nepalese (6.5%, a difference of 0.44%), and Salvadoran (6.5%, a difference of 0.61%).
| Demographics | Rating | Rank | Married-Couple Family Poverty |
| Blacks/African Americans | 0.0 /100 | #285 | Tragic 6.5% |
| Guyanese | 0.0 /100 | #286 | Tragic 6.5% |
| Ecuadorians | 0.0 /100 | #287 | Tragic 6.5% |
| Salvadorans | 0.0 /100 | #288 | Tragic 6.5% |
| Nepalese | 0.0 /100 | #289 | Tragic 6.5% |
| Immigrants | Barbados | 0.0 /100 | #290 | Tragic 6.5% |
| Belizeans | 0.0 /100 | #291 | Tragic 6.5% |
| Immigrants | Lebanon | 0.0 /100 | #292 | Tragic 6.6% |
| Arapaho | 0.0 /100 | #293 | Tragic 6.6% |
| Bahamians | 0.0 /100 | #294 | Tragic 6.6% |
| Immigrants | Uzbekistan | 0.0 /100 | #295 | Tragic 6.6% |
| U.S. Virgin Islanders | 0.0 /100 | #296 | Tragic 6.6% |
| Kiowa | 0.0 /100 | #297 | Tragic 6.6% |
| Immigrants | Guyana | 0.0 /100 | #298 | Tragic 6.7% |
| Nicaraguans | 0.0 /100 | #299 | Tragic 6.7% |