Paraguayan vs Immigrants from Lebanon Median Male Earnings
COMPARE
Paraguayan
Immigrants from Lebanon
Median Male Earnings
Median Male Earnings Comparison
Paraguayans
Immigrants from Lebanon
$59,975
MEDIAN MALE EARNINGS
99.5/ 100
METRIC RATING
77th/ 347
METRIC RANK
$58,835
MEDIAN MALE EARNINGS
98.6/ 100
METRIC RATING
95th/ 347
METRIC RANK
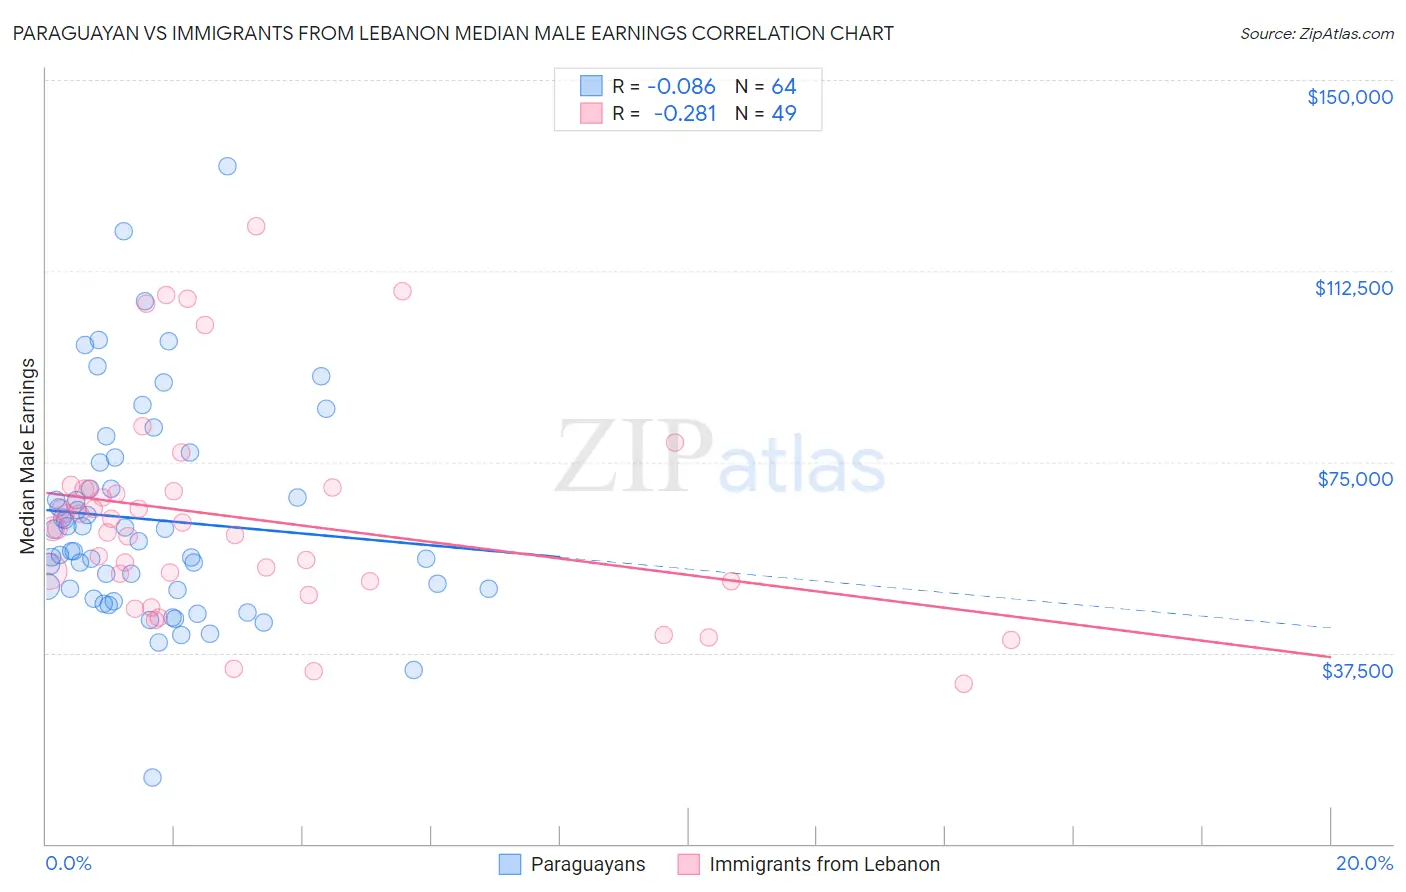
Paraguayan vs Immigrants from Lebanon Median Male Earnings Correlation Chart
The statistical analysis conducted on geographies consisting of 95,078,142 people shows a slight negative correlation between the proportion of Paraguayans and median male earnings in the United States with a correlation coefficient (R) of -0.086 and weighted average of $59,975. Similarly, the statistical analysis conducted on geographies consisting of 217,125,593 people shows a weak negative correlation between the proportion of Immigrants from Lebanon and median male earnings in the United States with a correlation coefficient (R) of -0.281 and weighted average of $58,835, a difference of 1.9%.
Median Male Earnings Correlation Summary
| Measurement | Paraguayan | Immigrants from Lebanon |
| Minimum | $13,000 | $31,325 |
| Maximum | $133,125 | $121,345 |
| Range | $120,125 | $90,020 |
| Mean | $63,648 | $64,055 |
| Median | $58,508 | $61,932 |
| Interquartile 25% (IQ1) | $49,873 | $51,586 |
| Interquartile 75% (IQ3) | $72,390 | $69,695 |
| Interquartile Range (IQR) | $22,517 | $18,109 |
| Standard Deviation (Sample) | $21,137 | $20,593 |
| Standard Deviation (Population) | $20,971 | $20,382 |
Demographics Similar to Paraguayans and Immigrants from Lebanon by Median Male Earnings
In terms of median male earnings, the demographic groups most similar to Paraguayans are Immigrants from Egypt ($59,925, a difference of 0.080%), Romanian ($60,063, a difference of 0.15%), Immigrants from Ukraine ($59,820, a difference of 0.26%), Immigrants from Hungary ($59,806, a difference of 0.28%), and Ukrainian ($59,728, a difference of 0.41%). Similarly, the demographic groups most similar to Immigrants from Lebanon are Albanian ($58,680, a difference of 0.27%), Immigrants from North Macedonia ($59,189, a difference of 0.60%), Immigrants from Southern Europe ($59,217, a difference of 0.65%), Immigrants from Kazakhstan ($59,278, a difference of 0.75%), and Laotian ($59,351, a difference of 0.88%).
| Demographics | Rating | Rank | Median Male Earnings |
| Romanians | 99.6 /100 | #76 | Exceptional $60,063 |
| Paraguayans | 99.5 /100 | #77 | Exceptional $59,975 |
| Immigrants | Egypt | 99.5 /100 | #78 | Exceptional $59,925 |
| Immigrants | Ukraine | 99.5 /100 | #79 | Exceptional $59,820 |
| Immigrants | Hungary | 99.5 /100 | #80 | Exceptional $59,806 |
| Ukrainians | 99.4 /100 | #81 | Exceptional $59,728 |
| Croatians | 99.4 /100 | #82 | Exceptional $59,715 |
| Immigrants | Italy | 99.4 /100 | #83 | Exceptional $59,691 |
| Afghans | 99.3 /100 | #84 | Exceptional $59,554 |
| Italians | 99.3 /100 | #85 | Exceptional $59,551 |
| Immigrants | England | 99.3 /100 | #86 | Exceptional $59,527 |
| Macedonians | 99.3 /100 | #87 | Exceptional $59,522 |
| Immigrants | Argentina | 99.3 /100 | #88 | Exceptional $59,491 |
| Immigrants | Moldova | 99.2 /100 | #89 | Exceptional $59,417 |
| Austrians | 99.2 /100 | #90 | Exceptional $59,359 |
| Laotians | 99.2 /100 | #91 | Exceptional $59,351 |
| Immigrants | Kazakhstan | 99.1 /100 | #92 | Exceptional $59,278 |
| Immigrants | Southern Europe | 99.0 /100 | #93 | Exceptional $59,217 |
| Immigrants | North Macedonia | 99.0 /100 | #94 | Exceptional $59,189 |
| Immigrants | Lebanon | 98.6 /100 | #95 | Exceptional $58,835 |
| Albanians | 98.4 /100 | #96 | Exceptional $58,680 |