Paraguayan vs Honduran 12th Grade, No Diploma
COMPARE
Paraguayan
Honduran
12th Grade, No Diploma
12th Grade, No Diploma Comparison
Paraguayans
Hondurans
91.5%
12TH GRADE, NO DIPLOMA
78.9/ 100
METRIC RATING
150th/ 347
METRIC RANK
85.5%
12TH GRADE, NO DIPLOMA
0.0/ 100
METRIC RATING
328th/ 347
METRIC RANK
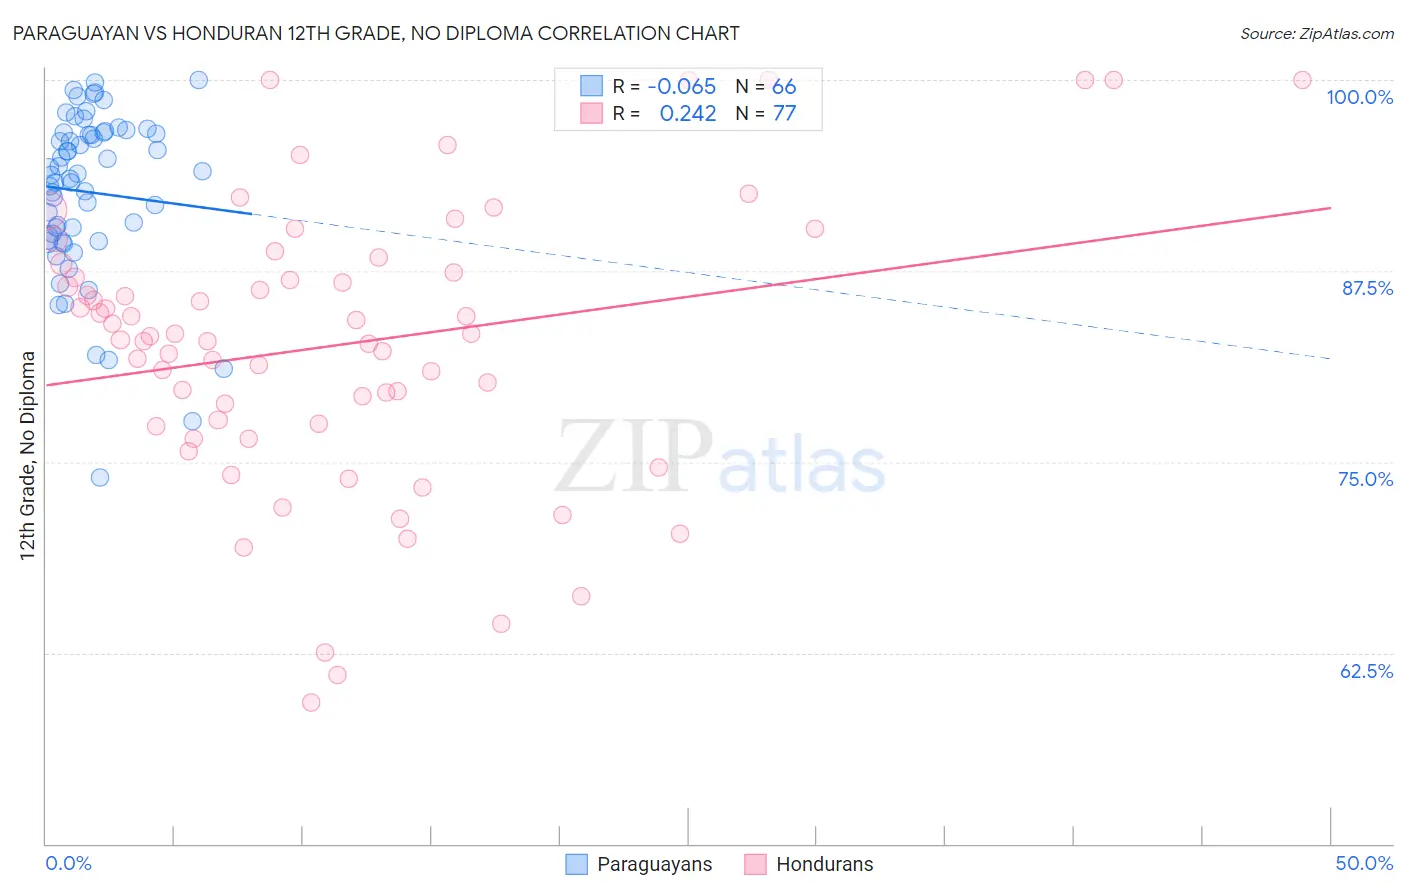
Paraguayan vs Honduran 12th Grade, No Diploma Correlation Chart
The statistical analysis conducted on geographies consisting of 95,114,201 people shows a slight negative correlation between the proportion of Paraguayans and percentage of population with at least 12th grade (no diploma) education in the United States with a correlation coefficient (R) of -0.065 and weighted average of 91.5%. Similarly, the statistical analysis conducted on geographies consisting of 357,858,827 people shows a weak positive correlation between the proportion of Hondurans and percentage of population with at least 12th grade (no diploma) education in the United States with a correlation coefficient (R) of 0.242 and weighted average of 85.5%, a difference of 7.0%.
12th Grade, No Diploma Correlation Summary
| Measurement | Paraguayan | Honduran |
| Minimum | 73.9% | 59.2% |
| Maximum | 100.0% | 100.0% |
| Range | 26.1% | 40.8% |
| Mean | 92.7% | 82.7% |
| Median | 93.8% | 83.3% |
| Interquartile 25% (IQ1) | 89.7% | 77.4% |
| Interquartile 75% (IQ3) | 96.6% | 87.7% |
| Interquartile Range (IQR) | 6.9% | 10.3% |
| Standard Deviation (Sample) | 5.4% | 9.2% |
| Standard Deviation (Population) | 5.4% | 9.1% |
Similar Demographics by 12th Grade, No Diploma
Demographics Similar to Paraguayans by 12th Grade, No Diploma
In terms of 12th grade, no diploma, the demographic groups most similar to Paraguayans are Ugandan (91.5%, a difference of 0.0%), Chippewa (91.5%, a difference of 0.0%), Pakistani (91.5%, a difference of 0.010%), Indian (Asian) (91.5%, a difference of 0.010%), and Immigrants from Spain (91.6%, a difference of 0.020%).
| Demographics | Rating | Rank | 12th Grade, No Diploma |
| Immigrants | Argentina | 80.7 /100 | #143 | Excellent 91.6% |
| Immigrants | Spain | 80.1 /100 | #144 | Excellent 91.6% |
| Immigrants | Lebanon | 80.0 /100 | #145 | Excellent 91.6% |
| Immigrants | Brazil | 79.8 /100 | #146 | Good 91.5% |
| Pakistanis | 79.6 /100 | #147 | Good 91.5% |
| Indians (Asian) | 79.4 /100 | #148 | Good 91.5% |
| Ugandans | 79.0 /100 | #149 | Good 91.5% |
| Paraguayans | 78.9 /100 | #150 | Good 91.5% |
| Chippewa | 78.8 /100 | #151 | Good 91.5% |
| Kenyans | 77.4 /100 | #152 | Good 91.5% |
| Iraqis | 75.3 /100 | #153 | Good 91.5% |
| Immigrants | Kenya | 73.9 /100 | #154 | Good 91.5% |
| Immigrants | Iraq | 73.0 /100 | #155 | Good 91.4% |
| Asians | 71.9 /100 | #156 | Good 91.4% |
| Immigrants | Pakistan | 70.7 /100 | #157 | Good 91.4% |
Demographics Similar to Hondurans by 12th Grade, No Diploma
In terms of 12th grade, no diploma, the demographic groups most similar to Hondurans are Hispanic or Latino (85.4%, a difference of 0.090%), Lumbee (85.7%, a difference of 0.19%), Dominican (85.7%, a difference of 0.20%), Mexican American Indian (85.7%, a difference of 0.22%), and Immigrants from the Azores (85.3%, a difference of 0.23%).
| Demographics | Rating | Rank | 12th Grade, No Diploma |
| Puerto Ricans | 0.0 /100 | #321 | Tragic 86.5% |
| Central American Indians | 0.0 /100 | #322 | Tragic 86.5% |
| Yuman | 0.0 /100 | #323 | Tragic 86.5% |
| Immigrants | Cabo Verde | 0.0 /100 | #324 | Tragic 85.8% |
| Mexican American Indians | 0.0 /100 | #325 | Tragic 85.7% |
| Dominicans | 0.0 /100 | #326 | Tragic 85.7% |
| Lumbee | 0.0 /100 | #327 | Tragic 85.7% |
| Hondurans | 0.0 /100 | #328 | Tragic 85.5% |
| Hispanics or Latinos | 0.0 /100 | #329 | Tragic 85.4% |
| Immigrants | Azores | 0.0 /100 | #330 | Tragic 85.3% |
| Central Americans | 0.0 /100 | #331 | Tragic 85.2% |
| Immigrants | Honduras | 0.0 /100 | #332 | Tragic 85.0% |
| Immigrants | Latin America | 0.0 /100 | #333 | Tragic 85.0% |
| Immigrants | Dominican Republic | 0.0 /100 | #334 | Tragic 84.9% |
| Immigrants | Yemen | 0.0 /100 | #335 | Tragic 84.8% |