Panamanian vs Trinidadian and Tobagonian Disability
COMPARE
Panamanian
Trinidadian and Tobagonian
Disability
Disability Comparison
Panamanians
Trinidadians and Tobagonians
12.1%
DISABILITY
5.4/ 100
METRIC RATING
216th/ 347
METRIC RANK
11.7%
DISABILITY
52.7/ 100
METRIC RATING
172nd/ 347
METRIC RANK
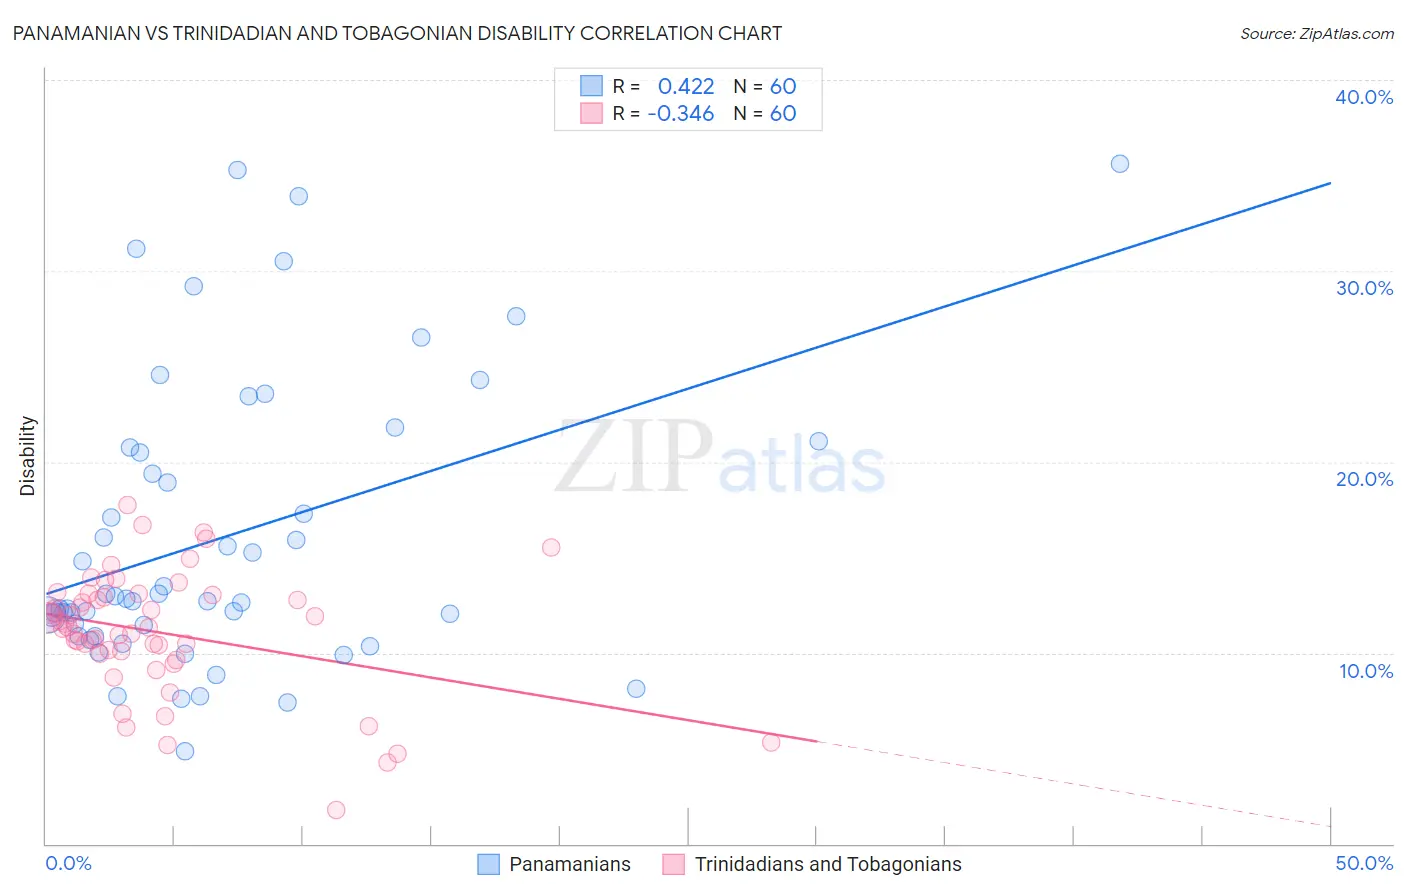
Panamanian vs Trinidadian and Tobagonian Disability Correlation Chart
The statistical analysis conducted on geographies consisting of 281,200,623 people shows a moderate positive correlation between the proportion of Panamanians and percentage of population with a disability in the United States with a correlation coefficient (R) of 0.422 and weighted average of 12.1%. Similarly, the statistical analysis conducted on geographies consisting of 219,849,540 people shows a mild negative correlation between the proportion of Trinidadians and Tobagonians and percentage of population with a disability in the United States with a correlation coefficient (R) of -0.346 and weighted average of 11.7%, a difference of 3.3%.
Disability Correlation Summary
| Measurement | Panamanian | Trinidadian and Tobagonian |
| Minimum | 4.8% | 1.7% |
| Maximum | 35.6% | 17.7% |
| Range | 30.8% | 16.0% |
| Mean | 16.1% | 11.1% |
| Median | 12.8% | 11.4% |
| Interquartile 25% (IQ1) | 11.2% | 10.0% |
| Interquartile 75% (IQ3) | 20.6% | 13.0% |
| Interquartile Range (IQR) | 9.5% | 2.9% |
| Standard Deviation (Sample) | 7.5% | 3.2% |
| Standard Deviation (Population) | 7.5% | 3.2% |
Similar Demographics by Disability
Demographics Similar to Panamanians by Disability
In terms of disability, the demographic groups most similar to Panamanians are Immigrants from North America (12.1%, a difference of 0.010%), Immigrants from Jamaica (12.1%, a difference of 0.070%), Croatian (12.1%, a difference of 0.11%), Immigrants from Canada (12.1%, a difference of 0.15%), and Immigrants from Bahamas (12.1%, a difference of 0.16%).
| Demographics | Rating | Rank | Disability |
| Danes | 8.7 /100 | #209 | Tragic 12.0% |
| Czechs | 7.9 /100 | #210 | Tragic 12.0% |
| Immigrants | Cambodia | 7.3 /100 | #211 | Tragic 12.0% |
| Austrians | 7.2 /100 | #212 | Tragic 12.0% |
| Immigrants | Iraq | 7.1 /100 | #213 | Tragic 12.0% |
| Immigrants | Somalia | 6.8 /100 | #214 | Tragic 12.0% |
| Immigrants | Canada | 6.1 /100 | #215 | Tragic 12.1% |
| Panamanians | 5.4 /100 | #216 | Tragic 12.1% |
| Immigrants | North America | 5.3 /100 | #217 | Tragic 12.1% |
| Immigrants | Jamaica | 5.0 /100 | #218 | Tragic 12.1% |
| Croatians | 4.9 /100 | #219 | Tragic 12.1% |
| Immigrants | Bahamas | 4.7 /100 | #220 | Tragic 12.1% |
| Northern Europeans | 4.2 /100 | #221 | Tragic 12.1% |
| Spanish American Indians | 4.1 /100 | #222 | Tragic 12.1% |
| Hispanics or Latinos | 3.9 /100 | #223 | Tragic 12.1% |
Demographics Similar to Trinidadians and Tobagonians by Disability
In terms of disability, the demographic groups most similar to Trinidadians and Tobagonians are Immigrants from Albania (11.7%, a difference of 0.010%), Immigrants from Southern Europe (11.7%, a difference of 0.010%), Immigrants from Austria (11.7%, a difference of 0.030%), Immigrants from Latin America (11.7%, a difference of 0.060%), and Estonian (11.7%, a difference of 0.080%).
| Demographics | Rating | Rank | Disability |
| Cubans | 56.7 /100 | #165 | Average 11.7% |
| Pakistanis | 54.7 /100 | #166 | Average 11.7% |
| Estonians | 54.4 /100 | #167 | Average 11.7% |
| Immigrants | Latin America | 54.1 /100 | #168 | Average 11.7% |
| Immigrants | Austria | 53.4 /100 | #169 | Average 11.7% |
| Immigrants | Albania | 52.8 /100 | #170 | Average 11.7% |
| Immigrants | Southern Europe | 52.8 /100 | #171 | Average 11.7% |
| Trinidadians and Tobagonians | 52.7 /100 | #172 | Average 11.7% |
| Maltese | 50.6 /100 | #173 | Average 11.7% |
| Albanians | 50.0 /100 | #174 | Average 11.7% |
| Haitians | 48.6 /100 | #175 | Average 11.7% |
| Immigrants | Western Africa | 47.5 /100 | #176 | Average 11.7% |
| Immigrants | Central America | 46.6 /100 | #177 | Average 11.7% |
| Greeks | 46.2 /100 | #178 | Average 11.7% |
| Immigrants | Armenia | 41.9 /100 | #179 | Average 11.7% |