Panamanian vs Immigrants from Czechoslovakia Family Poverty
COMPARE
Panamanian
Immigrants from Czechoslovakia
Family Poverty
Family Poverty Comparison
Panamanians
Immigrants from Czechoslovakia
9.8%
FAMILY POVERTY
5.6/ 100
METRIC RATING
218th/ 347
METRIC RANK
7.7%
FAMILY POVERTY
98.9/ 100
METRIC RATING
47th/ 347
METRIC RANK
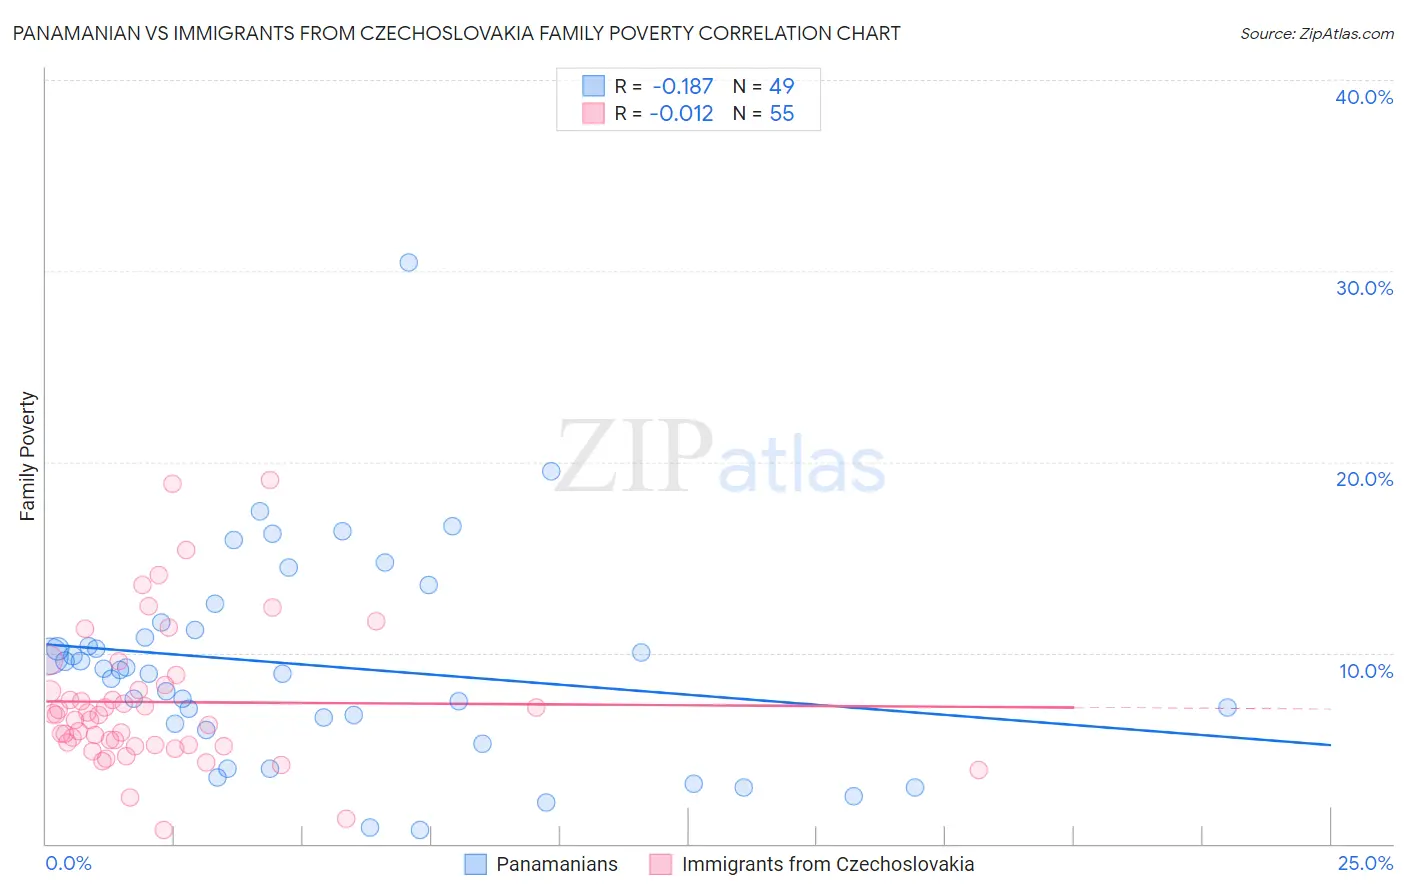
Panamanian vs Immigrants from Czechoslovakia Family Poverty Correlation Chart
The statistical analysis conducted on geographies consisting of 280,803,114 people shows a poor negative correlation between the proportion of Panamanians and poverty level among families in the United States with a correlation coefficient (R) of -0.187 and weighted average of 9.8%. Similarly, the statistical analysis conducted on geographies consisting of 195,180,585 people shows no correlation between the proportion of Immigrants from Czechoslovakia and poverty level among families in the United States with a correlation coefficient (R) of -0.012 and weighted average of 7.7%, a difference of 28.3%.
Family Poverty Correlation Summary
| Measurement | Panamanian | Immigrants from Czechoslovakia |
| Minimum | 0.72% | 0.73% |
| Maximum | 30.4% | 19.0% |
| Range | 29.7% | 18.3% |
| Mean | 9.3% | 7.4% |
| Median | 9.1% | 6.7% |
| Interquartile 25% (IQ1) | 6.1% | 5.2% |
| Interquartile 75% (IQ3) | 11.4% | 8.3% |
| Interquartile Range (IQR) | 5.3% | 3.1% |
| Standard Deviation (Sample) | 5.5% | 3.7% |
| Standard Deviation (Population) | 5.4% | 3.7% |
Similar Demographics by Family Poverty
Demographics Similar to Panamanians by Family Poverty
In terms of family poverty, the demographic groups most similar to Panamanians are Immigrants from Eritrea (9.9%, a difference of 0.13%), Bermudan (9.9%, a difference of 0.18%), American (9.8%, a difference of 0.32%), Immigrants from Cambodia (9.9%, a difference of 0.46%), and Japanese (9.9%, a difference of 0.49%).
| Demographics | Rating | Rank | Family Poverty |
| Malaysians | 10.6 /100 | #211 | Poor 9.6% |
| Immigrants | Thailand | 9.7 /100 | #212 | Tragic 9.7% |
| Osage | 8.0 /100 | #213 | Tragic 9.7% |
| Immigrants | Micronesia | 6.7 /100 | #214 | Tragic 9.8% |
| Immigrants | Nonimmigrants | 6.7 /100 | #215 | Tragic 9.8% |
| Moroccans | 6.5 /100 | #216 | Tragic 9.8% |
| Americans | 6.2 /100 | #217 | Tragic 9.8% |
| Panamanians | 5.6 /100 | #218 | Tragic 9.8% |
| Immigrants | Eritrea | 5.4 /100 | #219 | Tragic 9.9% |
| Bermudans | 5.3 /100 | #220 | Tragic 9.9% |
| Immigrants | Cambodia | 4.8 /100 | #221 | Tragic 9.9% |
| Japanese | 4.8 /100 | #222 | Tragic 9.9% |
| Immigrants | Africa | 4.3 /100 | #223 | Tragic 9.9% |
| Marshallese | 3.9 /100 | #224 | Tragic 9.9% |
| Immigrants | Immigrants | 3.6 /100 | #225 | Tragic 10.0% |
Demographics Similar to Immigrants from Czechoslovakia by Family Poverty
In terms of family poverty, the demographic groups most similar to Immigrants from Czechoslovakia are Tongan (7.7%, a difference of 0.010%), Immigrants from Sri Lanka (7.7%, a difference of 0.020%), Okinawan (7.7%, a difference of 0.030%), German (7.7%, a difference of 0.15%), and Immigrants from Bolivia (7.7%, a difference of 0.20%).
| Demographics | Rating | Rank | Family Poverty |
| Slovenes | 99.3 /100 | #40 | Exceptional 7.5% |
| Immigrants | Australia | 99.2 /100 | #41 | Exceptional 7.6% |
| Scandinavians | 99.1 /100 | #42 | Exceptional 7.6% |
| Immigrants | Austria | 99.1 /100 | #43 | Exceptional 7.6% |
| Germans | 99.0 /100 | #44 | Exceptional 7.7% |
| Okinawans | 98.9 /100 | #45 | Exceptional 7.7% |
| Tongans | 98.9 /100 | #46 | Exceptional 7.7% |
| Immigrants | Czechoslovakia | 98.9 /100 | #47 | Exceptional 7.7% |
| Immigrants | Sri Lanka | 98.9 /100 | #48 | Exceptional 7.7% |
| Immigrants | Bolivia | 98.9 /100 | #49 | Exceptional 7.7% |
| Immigrants | North Macedonia | 98.9 /100 | #50 | Exceptional 7.7% |
| Immigrants | Moldova | 98.8 /100 | #51 | Exceptional 7.7% |
| Indians (Asian) | 98.8 /100 | #52 | Exceptional 7.7% |
| Swiss | 98.8 /100 | #53 | Exceptional 7.7% |
| Immigrants | Sweden | 98.8 /100 | #54 | Exceptional 7.7% |