Panamanian vs Immigrants from Jordan Family Poverty
COMPARE
Panamanian
Immigrants from Jordan
Family Poverty
Family Poverty Comparison
Panamanians
Immigrants from Jordan
9.8%
FAMILY POVERTY
5.6/ 100
METRIC RATING
218th/ 347
METRIC RANK
8.5%
FAMILY POVERTY
83.0/ 100
METRIC RATING
147th/ 347
METRIC RANK
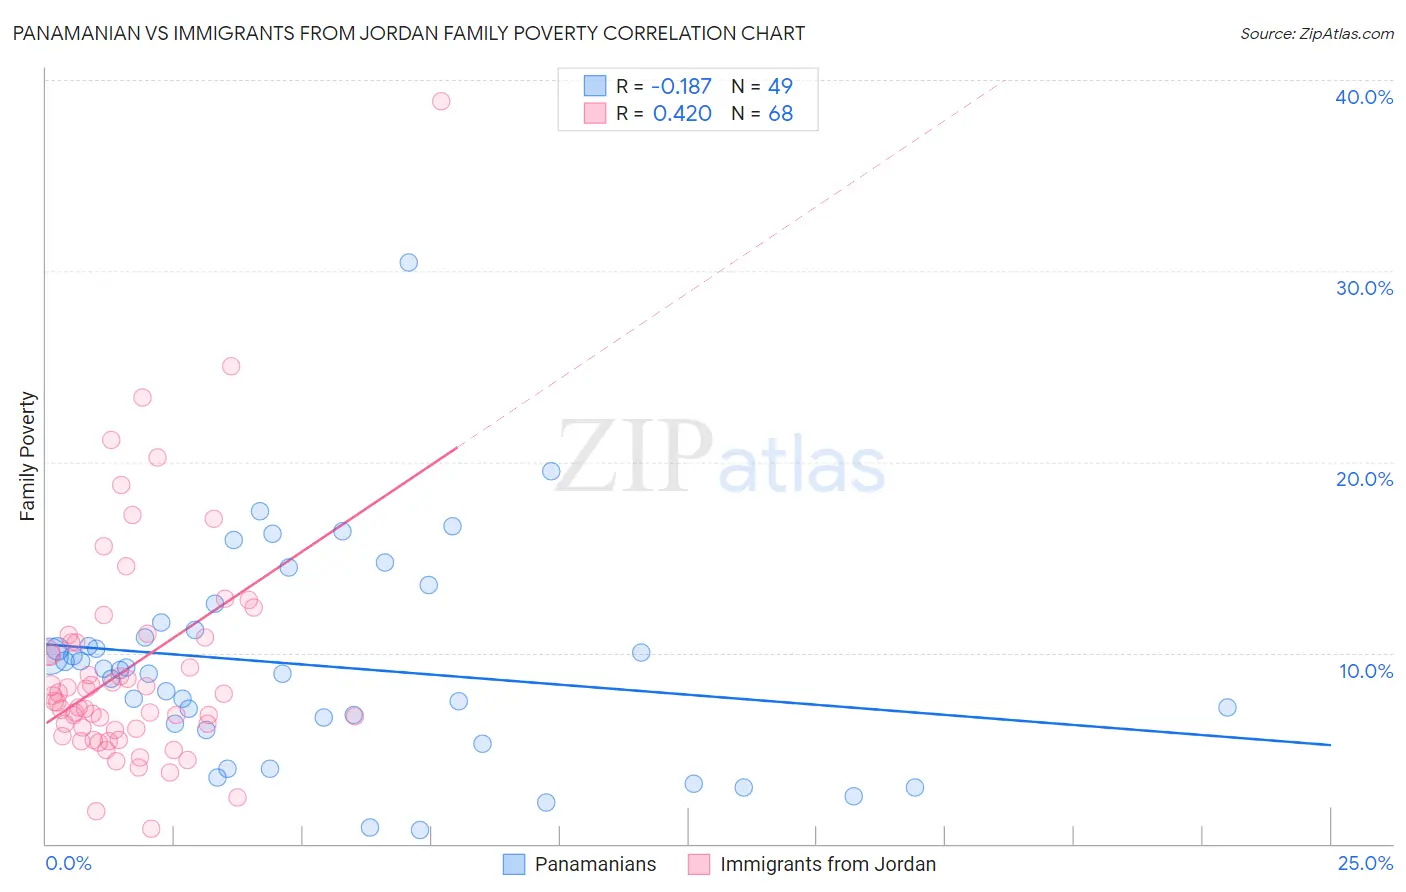
Panamanian vs Immigrants from Jordan Family Poverty Correlation Chart
The statistical analysis conducted on geographies consisting of 280,803,114 people shows a poor negative correlation between the proportion of Panamanians and poverty level among families in the United States with a correlation coefficient (R) of -0.187 and weighted average of 9.8%. Similarly, the statistical analysis conducted on geographies consisting of 181,199,618 people shows a moderate positive correlation between the proportion of Immigrants from Jordan and poverty level among families in the United States with a correlation coefficient (R) of 0.420 and weighted average of 8.5%, a difference of 15.2%.
Family Poverty Correlation Summary
| Measurement | Panamanian | Immigrants from Jordan |
| Minimum | 0.72% | 0.79% |
| Maximum | 30.4% | 38.9% |
| Range | 29.7% | 38.1% |
| Mean | 9.3% | 9.3% |
| Median | 9.1% | 7.6% |
| Interquartile 25% (IQ1) | 6.1% | 6.0% |
| Interquartile 75% (IQ3) | 11.4% | 10.7% |
| Interquartile Range (IQR) | 5.3% | 4.7% |
| Standard Deviation (Sample) | 5.5% | 6.1% |
| Standard Deviation (Population) | 5.4% | 6.0% |
Similar Demographics by Family Poverty
Demographics Similar to Panamanians by Family Poverty
In terms of family poverty, the demographic groups most similar to Panamanians are Immigrants from Eritrea (9.9%, a difference of 0.13%), Bermudan (9.9%, a difference of 0.18%), American (9.8%, a difference of 0.32%), Immigrants from Cambodia (9.9%, a difference of 0.46%), and Japanese (9.9%, a difference of 0.49%).
| Demographics | Rating | Rank | Family Poverty |
| Malaysians | 10.6 /100 | #211 | Poor 9.6% |
| Immigrants | Thailand | 9.7 /100 | #212 | Tragic 9.7% |
| Osage | 8.0 /100 | #213 | Tragic 9.7% |
| Immigrants | Micronesia | 6.7 /100 | #214 | Tragic 9.8% |
| Immigrants | Nonimmigrants | 6.7 /100 | #215 | Tragic 9.8% |
| Moroccans | 6.5 /100 | #216 | Tragic 9.8% |
| Americans | 6.2 /100 | #217 | Tragic 9.8% |
| Panamanians | 5.6 /100 | #218 | Tragic 9.8% |
| Immigrants | Eritrea | 5.4 /100 | #219 | Tragic 9.9% |
| Bermudans | 5.3 /100 | #220 | Tragic 9.9% |
| Immigrants | Cambodia | 4.8 /100 | #221 | Tragic 9.9% |
| Japanese | 4.8 /100 | #222 | Tragic 9.9% |
| Immigrants | Africa | 4.3 /100 | #223 | Tragic 9.9% |
| Marshallese | 3.9 /100 | #224 | Tragic 9.9% |
| Immigrants | Immigrants | 3.6 /100 | #225 | Tragic 10.0% |
Demographics Similar to Immigrants from Jordan by Family Poverty
In terms of family poverty, the demographic groups most similar to Immigrants from Jordan are Immigrants from Belarus (8.5%, a difference of 0.030%), Immigrants from South Eastern Asia (8.5%, a difference of 0.050%), Albanian (8.5%, a difference of 0.060%), Immigrants from Germany (8.5%, a difference of 0.080%), and Yugoslavian (8.5%, a difference of 0.12%).
| Demographics | Rating | Rank | Family Poverty |
| Immigrants | Kazakhstan | 84.1 /100 | #140 | Excellent 8.5% |
| Immigrants | Ukraine | 83.9 /100 | #141 | Excellent 8.5% |
| Yugoslavians | 83.5 /100 | #142 | Excellent 8.5% |
| Immigrants | Germany | 83.3 /100 | #143 | Excellent 8.5% |
| Albanians | 83.3 /100 | #144 | Excellent 8.5% |
| Immigrants | South Eastern Asia | 83.2 /100 | #145 | Excellent 8.5% |
| Immigrants | Belarus | 83.2 /100 | #146 | Excellent 8.5% |
| Immigrants | Jordan | 83.0 /100 | #147 | Excellent 8.5% |
| Scotch-Irish | 82.2 /100 | #148 | Excellent 8.6% |
| Mongolians | 80.4 /100 | #149 | Excellent 8.6% |
| Syrians | 80.3 /100 | #150 | Excellent 8.6% |
| Brazilians | 80.1 /100 | #151 | Excellent 8.6% |
| Samoans | 79.8 /100 | #152 | Good 8.6% |
| Immigrants | Spain | 79.1 /100 | #153 | Good 8.6% |
| Immigrants | Vietnam | 75.4 /100 | #154 | Good 8.7% |