Pakistani vs New Zealander Child Poverty Among Girls Under 16
COMPARE
Pakistani
New Zealander
Child Poverty Among Girls Under 16
Child Poverty Among Girls Under 16 Comparison
Pakistanis
New Zealanders
15.3%
CHILD POVERTY AMONG GIRLS UNDER 16
92.3/ 100
METRIC RATING
120th/ 347
METRIC RANK
15.6%
CHILD POVERTY AMONG GIRLS UNDER 16
87.2/ 100
METRIC RATING
140th/ 347
METRIC RANK
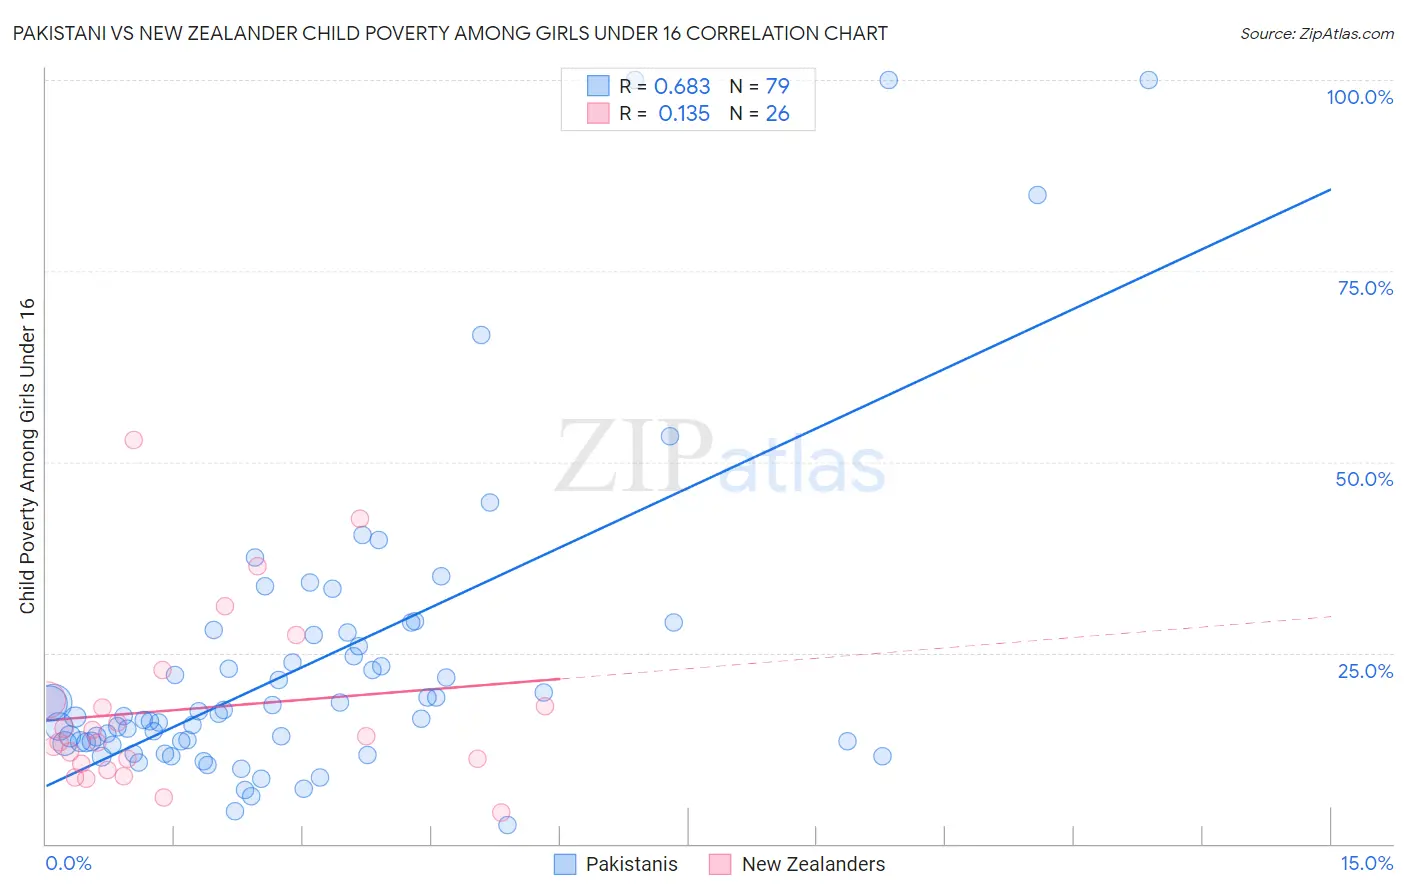
Pakistani vs New Zealander Child Poverty Among Girls Under 16 Correlation Chart
The statistical analysis conducted on geographies consisting of 331,174,379 people shows a significant positive correlation between the proportion of Pakistanis and poverty level among girls under the age of 16 in the United States with a correlation coefficient (R) of 0.683 and weighted average of 15.3%. Similarly, the statistical analysis conducted on geographies consisting of 106,265,230 people shows a poor positive correlation between the proportion of New Zealanders and poverty level among girls under the age of 16 in the United States with a correlation coefficient (R) of 0.135 and weighted average of 15.6%, a difference of 1.7%.
Child Poverty Among Girls Under 16 Correlation Summary
| Measurement | Pakistani | New Zealander |
| Minimum | 2.5% | 4.2% |
| Maximum | 100.0% | 52.9% |
| Range | 97.5% | 48.7% |
| Mean | 23.5% | 17.6% |
| Median | 16.7% | 13.7% |
| Interquartile 25% (IQ1) | 13.2% | 10.4% |
| Interquartile 75% (IQ3) | 27.3% | 18.8% |
| Interquartile Range (IQR) | 14.1% | 8.4% |
| Standard Deviation (Sample) | 20.1% | 11.6% |
| Standard Deviation (Population) | 20.0% | 11.4% |
Demographics Similar to Pakistanis and New Zealanders by Child Poverty Among Girls Under 16
In terms of child poverty among girls under 16, the demographic groups most similar to Pakistanis are English (15.3%, a difference of 0.020%), Portuguese (15.3%, a difference of 0.21%), Irish (15.3%, a difference of 0.31%), Carpatho Rusyn (15.3%, a difference of 0.35%), and Peruvian (15.4%, a difference of 0.46%). Similarly, the demographic groups most similar to New Zealanders are Armenian (15.5%, a difference of 0.18%), Immigrants from Vietnam (15.5%, a difference of 0.28%), South African (15.5%, a difference of 0.41%), Native Hawaiian (15.5%, a difference of 0.50%), and Czechoslovakian (15.5%, a difference of 0.52%).
| Demographics | Rating | Rank | Child Poverty Among Girls Under 16 |
| Pakistanis | 92.3 /100 | #120 | Exceptional 15.3% |
| English | 92.2 /100 | #121 | Exceptional 15.3% |
| Portuguese | 91.8 /100 | #122 | Exceptional 15.3% |
| Irish | 91.5 /100 | #123 | Exceptional 15.3% |
| Carpatho Rusyns | 91.4 /100 | #124 | Exceptional 15.3% |
| Peruvians | 91.2 /100 | #125 | Exceptional 15.4% |
| Scottish | 91.0 /100 | #126 | Exceptional 15.4% |
| Immigrants | Norway | 90.8 /100 | #127 | Exceptional 15.4% |
| Albanians | 90.5 /100 | #128 | Exceptional 15.4% |
| Immigrants | South Eastern Asia | 90.5 /100 | #129 | Exceptional 15.4% |
| Puget Sound Salish | 90.1 /100 | #130 | Exceptional 15.4% |
| Immigrants | Western Europe | 90.0 /100 | #131 | Exceptional 15.4% |
| Mongolians | 89.7 /100 | #132 | Excellent 15.4% |
| Brazilians | 89.6 /100 | #133 | Excellent 15.4% |
| Immigrants | Spain | 89.1 /100 | #134 | Excellent 15.5% |
| Czechoslovakians | 89.0 /100 | #135 | Excellent 15.5% |
| Native Hawaiians | 89.0 /100 | #136 | Excellent 15.5% |
| South Africans | 88.7 /100 | #137 | Excellent 15.5% |
| Immigrants | Vietnam | 88.2 /100 | #138 | Excellent 15.5% |
| Armenians | 87.9 /100 | #139 | Excellent 15.5% |
| New Zealanders | 87.2 /100 | #140 | Excellent 15.6% |