Immigrants from Lithuania vs New Zealander Single Female Poverty
COMPARE
Immigrants from Lithuania
New Zealander
Single Female Poverty
Single Female Poverty Comparison
Immigrants from Lithuania
New Zealanders
17.8%
SINGLE FEMALE POVERTY
100.0/ 100
METRIC RATING
11th/ 347
METRIC RANK
21.0%
SINGLE FEMALE POVERTY
53.2/ 100
METRIC RATING
170th/ 347
METRIC RANK
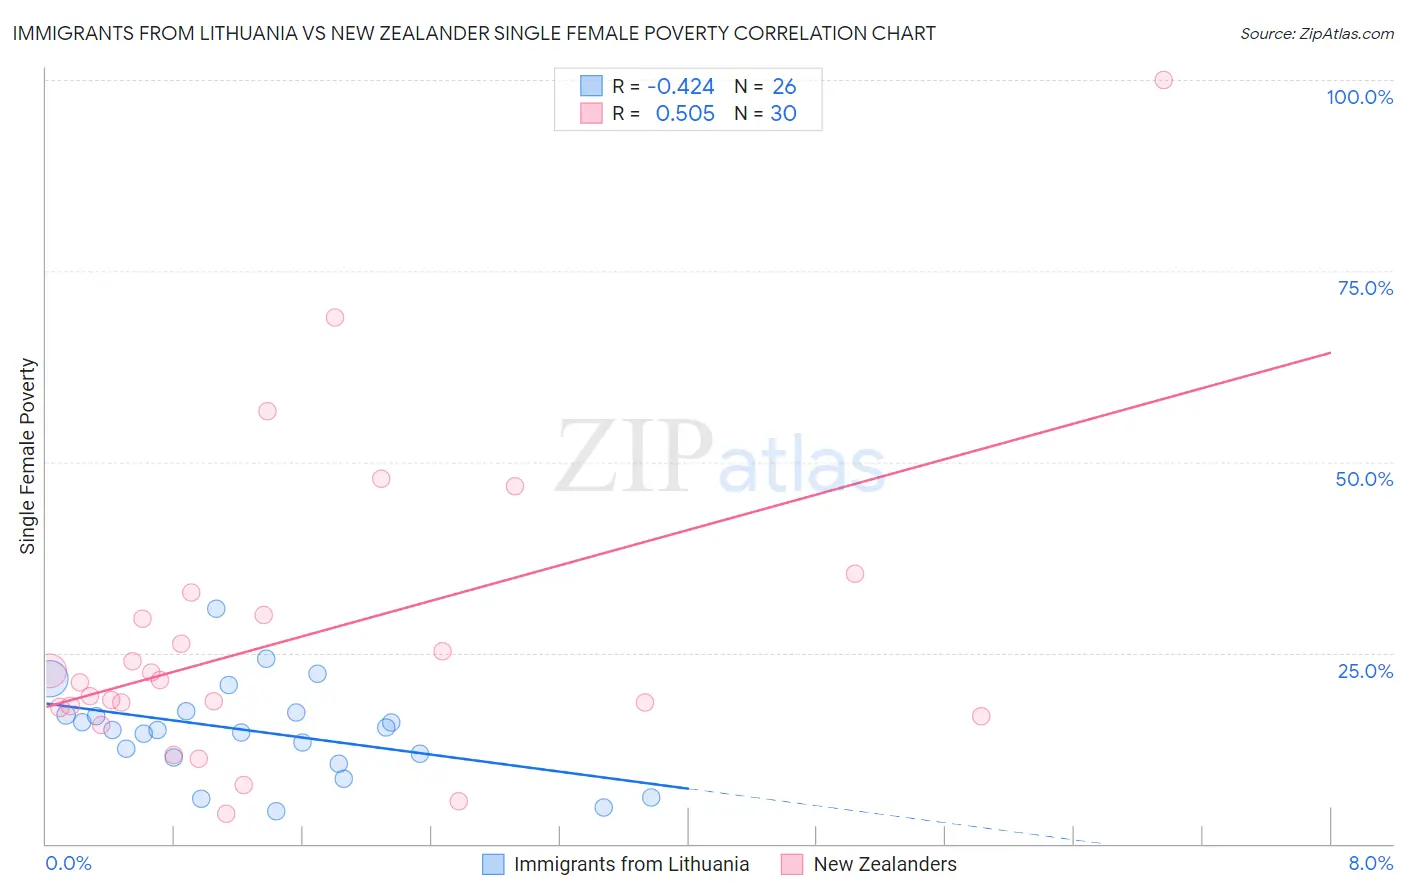
Immigrants from Lithuania vs New Zealander Single Female Poverty Correlation Chart
The statistical analysis conducted on geographies consisting of 116,892,262 people shows a moderate negative correlation between the proportion of Immigrants from Lithuania and poverty level among single females in the United States with a correlation coefficient (R) of -0.424 and weighted average of 17.8%. Similarly, the statistical analysis conducted on geographies consisting of 106,229,490 people shows a substantial positive correlation between the proportion of New Zealanders and poverty level among single females in the United States with a correlation coefficient (R) of 0.505 and weighted average of 21.0%, a difference of 17.9%.
Single Female Poverty Correlation Summary
| Measurement | Immigrants from Lithuania | New Zealander |
| Minimum | 4.2% | 3.9% |
| Maximum | 30.7% | 100.0% |
| Range | 26.6% | 96.1% |
| Mean | 14.7% | 27.1% |
| Median | 14.9% | 21.3% |
| Interquartile 25% (IQ1) | 11.3% | 17.8% |
| Interquartile 75% (IQ3) | 17.2% | 29.9% |
| Interquartile Range (IQR) | 6.0% | 12.0% |
| Standard Deviation (Sample) | 6.2% | 20.0% |
| Standard Deviation (Population) | 6.1% | 19.7% |
Similar Demographics by Single Female Poverty
Demographics Similar to Immigrants from Lithuania by Single Female Poverty
In terms of single female poverty, the demographic groups most similar to Immigrants from Lithuania are Immigrants from South Central Asia (17.8%, a difference of 0.060%), Immigrants from Ireland (17.8%, a difference of 0.090%), Immigrants from Bolivia (17.8%, a difference of 0.32%), Bhutanese (17.7%, a difference of 0.50%), and Bolivian (17.9%, a difference of 0.76%).
| Demographics | Rating | Rank | Single Female Poverty |
| Immigrants | India | 100.0 /100 | #4 | Exceptional 16.8% |
| Assyrians/Chaldeans/Syriacs | 100.0 /100 | #5 | Exceptional 17.0% |
| Filipinos | 100.0 /100 | #6 | Exceptional 17.0% |
| Thais | 100.0 /100 | #7 | Exceptional 17.3% |
| Immigrants | Iran | 100.0 /100 | #8 | Exceptional 17.5% |
| Bhutanese | 100.0 /100 | #9 | Exceptional 17.7% |
| Immigrants | Ireland | 100.0 /100 | #10 | Exceptional 17.8% |
| Immigrants | Lithuania | 100.0 /100 | #11 | Exceptional 17.8% |
| Immigrants | South Central Asia | 100.0 /100 | #12 | Exceptional 17.8% |
| Immigrants | Bolivia | 100.0 /100 | #13 | Exceptional 17.8% |
| Bolivians | 100.0 /100 | #14 | Exceptional 17.9% |
| Indians (Asian) | 100.0 /100 | #15 | Exceptional 17.9% |
| Iranians | 100.0 /100 | #16 | Exceptional 18.0% |
| Immigrants | Korea | 100.0 /100 | #17 | Exceptional 18.1% |
| Immigrants | Eastern Asia | 100.0 /100 | #18 | Exceptional 18.1% |
Demographics Similar to New Zealanders by Single Female Poverty
In terms of single female poverty, the demographic groups most similar to New Zealanders are Moroccan (21.0%, a difference of 0.020%), Guyanese (21.0%, a difference of 0.070%), Immigrants from Guyana (21.0%, a difference of 0.16%), Immigrants from Trinidad and Tobago (20.9%, a difference of 0.20%), and Cuban (21.0%, a difference of 0.20%).
| Demographics | Rating | Rank | Single Female Poverty |
| Lebanese | 67.6 /100 | #163 | Good 20.8% |
| Iraqis | 64.5 /100 | #164 | Good 20.8% |
| Ugandans | 64.0 /100 | #165 | Good 20.8% |
| Norwegians | 63.0 /100 | #166 | Good 20.8% |
| Immigrants | Norway | 63.0 /100 | #167 | Good 20.8% |
| Immigrants | Costa Rica | 61.5 /100 | #168 | Good 20.9% |
| Immigrants | Trinidad and Tobago | 56.3 /100 | #169 | Average 20.9% |
| New Zealanders | 53.2 /100 | #170 | Average 21.0% |
| Moroccans | 52.8 /100 | #171 | Average 21.0% |
| Guyanese | 52.0 /100 | #172 | Average 21.0% |
| Immigrants | Guyana | 50.6 /100 | #173 | Average 21.0% |
| Cubans | 50.0 /100 | #174 | Average 21.0% |
| Czechs | 46.8 /100 | #175 | Average 21.0% |
| Canadians | 45.4 /100 | #176 | Average 21.1% |
| Scandinavians | 45.2 /100 | #177 | Average 21.1% |