Icelander vs New Zealander Single Female Poverty
COMPARE
Icelander
New Zealander
Single Female Poverty
Single Female Poverty Comparison
Icelanders
New Zealanders
21.6%
SINGLE FEMALE POVERTY
14.0/ 100
METRIC RATING
211th/ 347
METRIC RANK
21.0%
SINGLE FEMALE POVERTY
53.2/ 100
METRIC RATING
170th/ 347
METRIC RANK
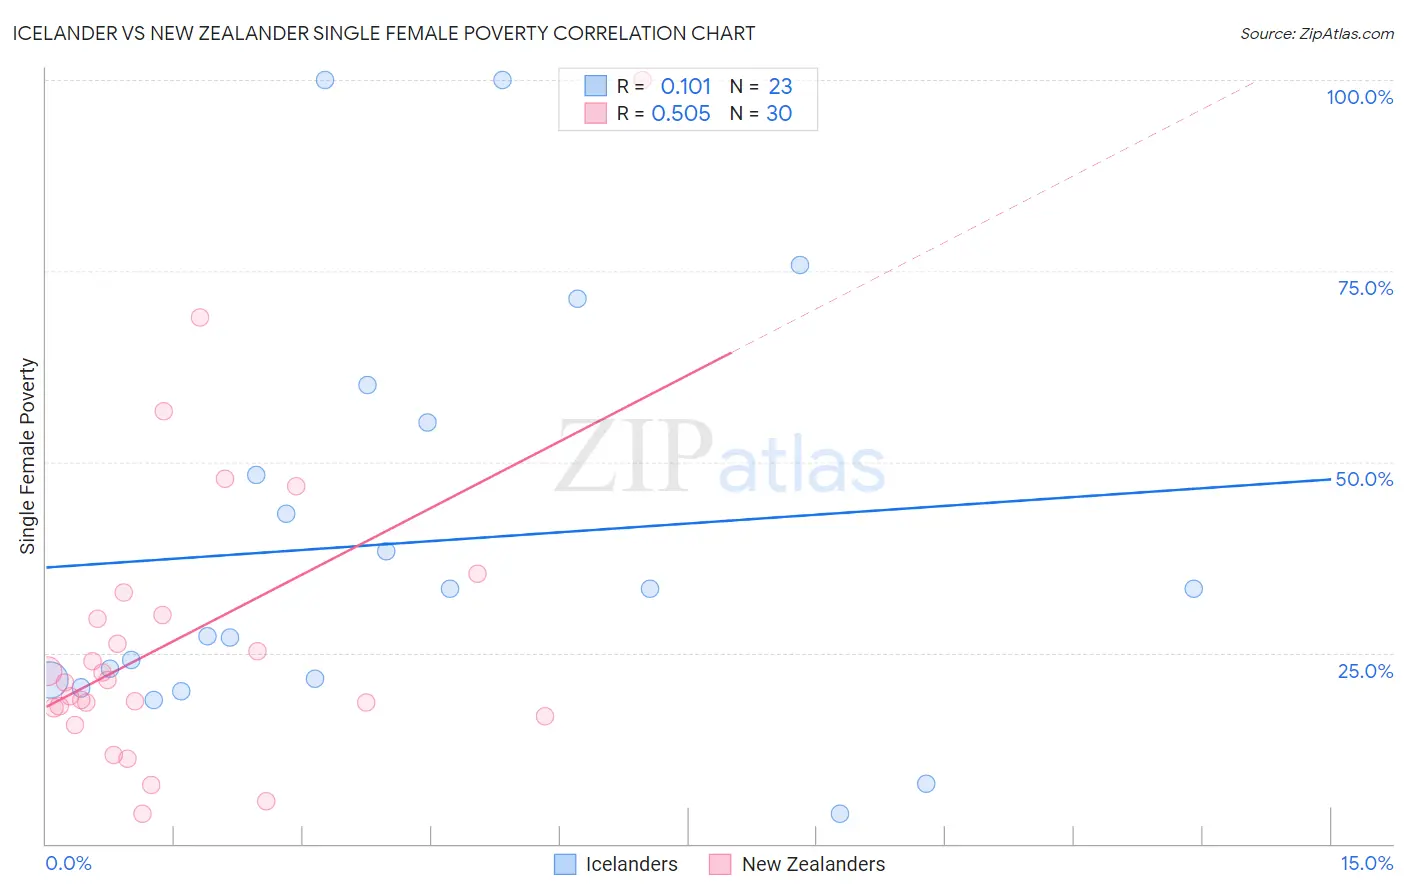
Icelander vs New Zealander Single Female Poverty Correlation Chart
The statistical analysis conducted on geographies consisting of 158,245,143 people shows a poor positive correlation between the proportion of Icelanders and poverty level among single females in the United States with a correlation coefficient (R) of 0.101 and weighted average of 21.6%. Similarly, the statistical analysis conducted on geographies consisting of 106,229,490 people shows a substantial positive correlation between the proportion of New Zealanders and poverty level among single females in the United States with a correlation coefficient (R) of 0.505 and weighted average of 21.0%, a difference of 3.0%.
Single Female Poverty Correlation Summary
| Measurement | Icelander | New Zealander |
| Minimum | 3.9% | 3.9% |
| Maximum | 100.0% | 100.0% |
| Range | 96.1% | 96.1% |
| Mean | 39.4% | 27.1% |
| Median | 33.3% | 21.3% |
| Interquartile 25% (IQ1) | 21.4% | 17.8% |
| Interquartile 75% (IQ3) | 55.2% | 29.9% |
| Interquartile Range (IQR) | 33.8% | 12.0% |
| Standard Deviation (Sample) | 26.5% | 20.0% |
| Standard Deviation (Population) | 25.9% | 19.7% |
Similar Demographics by Single Female Poverty
Demographics Similar to Icelanders by Single Female Poverty
In terms of single female poverty, the demographic groups most similar to Icelanders are Jamaican (21.6%, a difference of 0.010%), Immigrants from Panama (21.6%, a difference of 0.040%), Guamanian/Chamorro (21.6%, a difference of 0.040%), Immigrants from Nicaragua (21.6%, a difference of 0.10%), and Immigrants from Eastern Africa (21.6%, a difference of 0.13%).
| Demographics | Rating | Rank | Single Female Poverty |
| Immigrants | Africa | 16.7 /100 | #204 | Poor 21.5% |
| Finns | 16.2 /100 | #205 | Poor 21.5% |
| Belgians | 16.1 /100 | #206 | Poor 21.5% |
| Ghanaians | 15.7 /100 | #207 | Poor 21.6% |
| Haitians | 15.4 /100 | #208 | Poor 21.6% |
| Immigrants | Eastern Africa | 15.1 /100 | #209 | Poor 21.6% |
| Immigrants | Panama | 14.4 /100 | #210 | Poor 21.6% |
| Icelanders | 14.0 /100 | #211 | Poor 21.6% |
| Jamaicans | 14.0 /100 | #212 | Poor 21.6% |
| Guamanians/Chamorros | 13.7 /100 | #213 | Poor 21.6% |
| Immigrants | Nicaragua | 13.3 /100 | #214 | Poor 21.6% |
| Ecuadorians | 12.3 /100 | #215 | Poor 21.6% |
| Immigrants | Barbados | 12.2 /100 | #216 | Poor 21.7% |
| Immigrants | St. Vincent and the Grenadines | 11.7 /100 | #217 | Poor 21.7% |
| Nepalese | 9.7 /100 | #218 | Tragic 21.7% |
Demographics Similar to New Zealanders by Single Female Poverty
In terms of single female poverty, the demographic groups most similar to New Zealanders are Moroccan (21.0%, a difference of 0.020%), Guyanese (21.0%, a difference of 0.070%), Immigrants from Guyana (21.0%, a difference of 0.16%), Immigrants from Trinidad and Tobago (20.9%, a difference of 0.20%), and Cuban (21.0%, a difference of 0.20%).
| Demographics | Rating | Rank | Single Female Poverty |
| Lebanese | 67.6 /100 | #163 | Good 20.8% |
| Iraqis | 64.5 /100 | #164 | Good 20.8% |
| Ugandans | 64.0 /100 | #165 | Good 20.8% |
| Norwegians | 63.0 /100 | #166 | Good 20.8% |
| Immigrants | Norway | 63.0 /100 | #167 | Good 20.8% |
| Immigrants | Costa Rica | 61.5 /100 | #168 | Good 20.9% |
| Immigrants | Trinidad and Tobago | 56.3 /100 | #169 | Average 20.9% |
| New Zealanders | 53.2 /100 | #170 | Average 21.0% |
| Moroccans | 52.8 /100 | #171 | Average 21.0% |
| Guyanese | 52.0 /100 | #172 | Average 21.0% |
| Immigrants | Guyana | 50.6 /100 | #173 | Average 21.0% |
| Cubans | 50.0 /100 | #174 | Average 21.0% |
| Czechs | 46.8 /100 | #175 | Average 21.0% |
| Canadians | 45.4 /100 | #176 | Average 21.1% |
| Scandinavians | 45.2 /100 | #177 | Average 21.1% |