Pakistani vs Ghanaian Child Poverty Among Girls Under 16
COMPARE
Pakistani
Ghanaian
Child Poverty Among Girls Under 16
Child Poverty Among Girls Under 16 Comparison
Pakistanis
Ghanaians
15.3%
CHILD POVERTY AMONG GIRLS UNDER 16
92.3/ 100
METRIC RATING
120th/ 347
METRIC RANK
18.5%
CHILD POVERTY AMONG GIRLS UNDER 16
1.4/ 100
METRIC RATING
229th/ 347
METRIC RANK
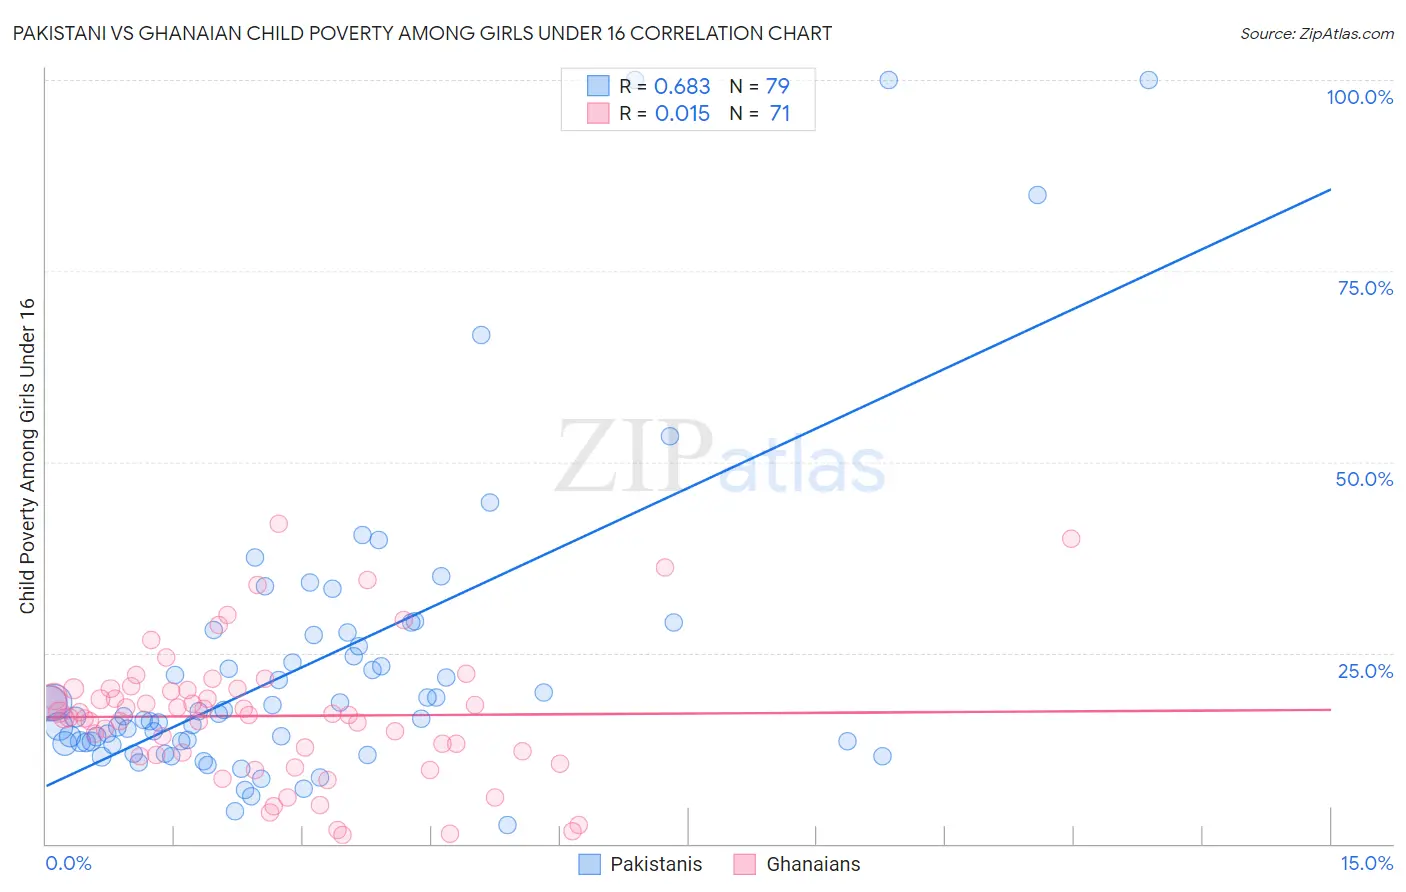
Pakistani vs Ghanaian Child Poverty Among Girls Under 16 Correlation Chart
The statistical analysis conducted on geographies consisting of 331,174,379 people shows a significant positive correlation between the proportion of Pakistanis and poverty level among girls under the age of 16 in the United States with a correlation coefficient (R) of 0.683 and weighted average of 15.3%. Similarly, the statistical analysis conducted on geographies consisting of 189,052,408 people shows no correlation between the proportion of Ghanaians and poverty level among girls under the age of 16 in the United States with a correlation coefficient (R) of 0.015 and weighted average of 18.5%, a difference of 20.9%.
Child Poverty Among Girls Under 16 Correlation Summary
| Measurement | Pakistani | Ghanaian |
| Minimum | 2.5% | 1.1% |
| Maximum | 100.0% | 41.8% |
| Range | 97.5% | 40.7% |
| Mean | 23.5% | 16.7% |
| Median | 16.7% | 16.8% |
| Interquartile 25% (IQ1) | 13.2% | 11.7% |
| Interquartile 75% (IQ3) | 27.3% | 20.2% |
| Interquartile Range (IQR) | 14.1% | 8.6% |
| Standard Deviation (Sample) | 20.1% | 8.7% |
| Standard Deviation (Population) | 20.0% | 8.6% |
Similar Demographics by Child Poverty Among Girls Under 16
Demographics Similar to Pakistanis by Child Poverty Among Girls Under 16
In terms of child poverty among girls under 16, the demographic groups most similar to Pakistanis are English (15.3%, a difference of 0.020%), Immigrants from Zimbabwe (15.3%, a difference of 0.090%), Immigrants from Southern Europe (15.3%, a difference of 0.20%), Portuguese (15.3%, a difference of 0.21%), and Irish (15.3%, a difference of 0.31%).
| Demographics | Rating | Rank | Child Poverty Among Girls Under 16 |
| Dutch | 94.3 /100 | #113 | Exceptional 15.1% |
| Sri Lankans | 94.0 /100 | #114 | Exceptional 15.2% |
| Belgians | 93.9 /100 | #115 | Exceptional 15.2% |
| Immigrants | Denmark | 93.3 /100 | #116 | Exceptional 15.2% |
| Immigrants | North Macedonia | 93.1 /100 | #117 | Exceptional 15.2% |
| Immigrants | Southern Europe | 92.7 /100 | #118 | Exceptional 15.3% |
| Immigrants | Zimbabwe | 92.5 /100 | #119 | Exceptional 15.3% |
| Pakistanis | 92.3 /100 | #120 | Exceptional 15.3% |
| English | 92.2 /100 | #121 | Exceptional 15.3% |
| Portuguese | 91.8 /100 | #122 | Exceptional 15.3% |
| Irish | 91.5 /100 | #123 | Exceptional 15.3% |
| Carpatho Rusyns | 91.4 /100 | #124 | Exceptional 15.3% |
| Peruvians | 91.2 /100 | #125 | Exceptional 15.4% |
| Scottish | 91.0 /100 | #126 | Exceptional 15.4% |
| Immigrants | Norway | 90.8 /100 | #127 | Exceptional 15.4% |
Demographics Similar to Ghanaians by Child Poverty Among Girls Under 16
In terms of child poverty among girls under 16, the demographic groups most similar to Ghanaians are Osage (18.5%, a difference of 0.19%), Cree (18.5%, a difference of 0.27%), Immigrants from Sudan (18.6%, a difference of 0.52%), Sudanese (18.6%, a difference of 0.56%), and Fijian (18.6%, a difference of 0.63%).
| Demographics | Rating | Rank | Child Poverty Among Girls Under 16 |
| Immigrants | Cambodia | 2.9 /100 | #222 | Tragic 18.1% |
| Immigrants | Armenia | 2.9 /100 | #223 | Tragic 18.1% |
| Bermudans | 2.8 /100 | #224 | Tragic 18.1% |
| Immigrants | Africa | 2.7 /100 | #225 | Tragic 18.2% |
| Nicaraguans | 2.4 /100 | #226 | Tragic 18.2% |
| Immigrants | Nonimmigrants | 2.0 /100 | #227 | Tragic 18.3% |
| Alaskan Athabascans | 2.0 /100 | #228 | Tragic 18.3% |
| Ghanaians | 1.4 /100 | #229 | Tragic 18.5% |
| Osage | 1.3 /100 | #230 | Tragic 18.5% |
| Cree | 1.3 /100 | #231 | Tragic 18.5% |
| Immigrants | Sudan | 1.1 /100 | #232 | Tragic 18.6% |
| Sudanese | 1.1 /100 | #233 | Tragic 18.6% |
| Fijians | 1.1 /100 | #234 | Tragic 18.6% |
| Nepalese | 1.1 /100 | #235 | Tragic 18.6% |
| Alsatians | 1.1 /100 | #236 | Tragic 18.6% |