Immigrants from Zaire vs Immigrants from Caribbean Single Male Poverty
COMPARE
Immigrants from Zaire
Immigrants from Caribbean
Single Male Poverty
Single Male Poverty Comparison
Immigrants from Zaire
Immigrants from Caribbean
13.6%
SINGLE MALE POVERTY
0.9/ 100
METRIC RATING
251st/ 347
METRIC RANK
13.3%
SINGLE MALE POVERTY
5.0/ 100
METRIC RATING
232nd/ 347
METRIC RANK
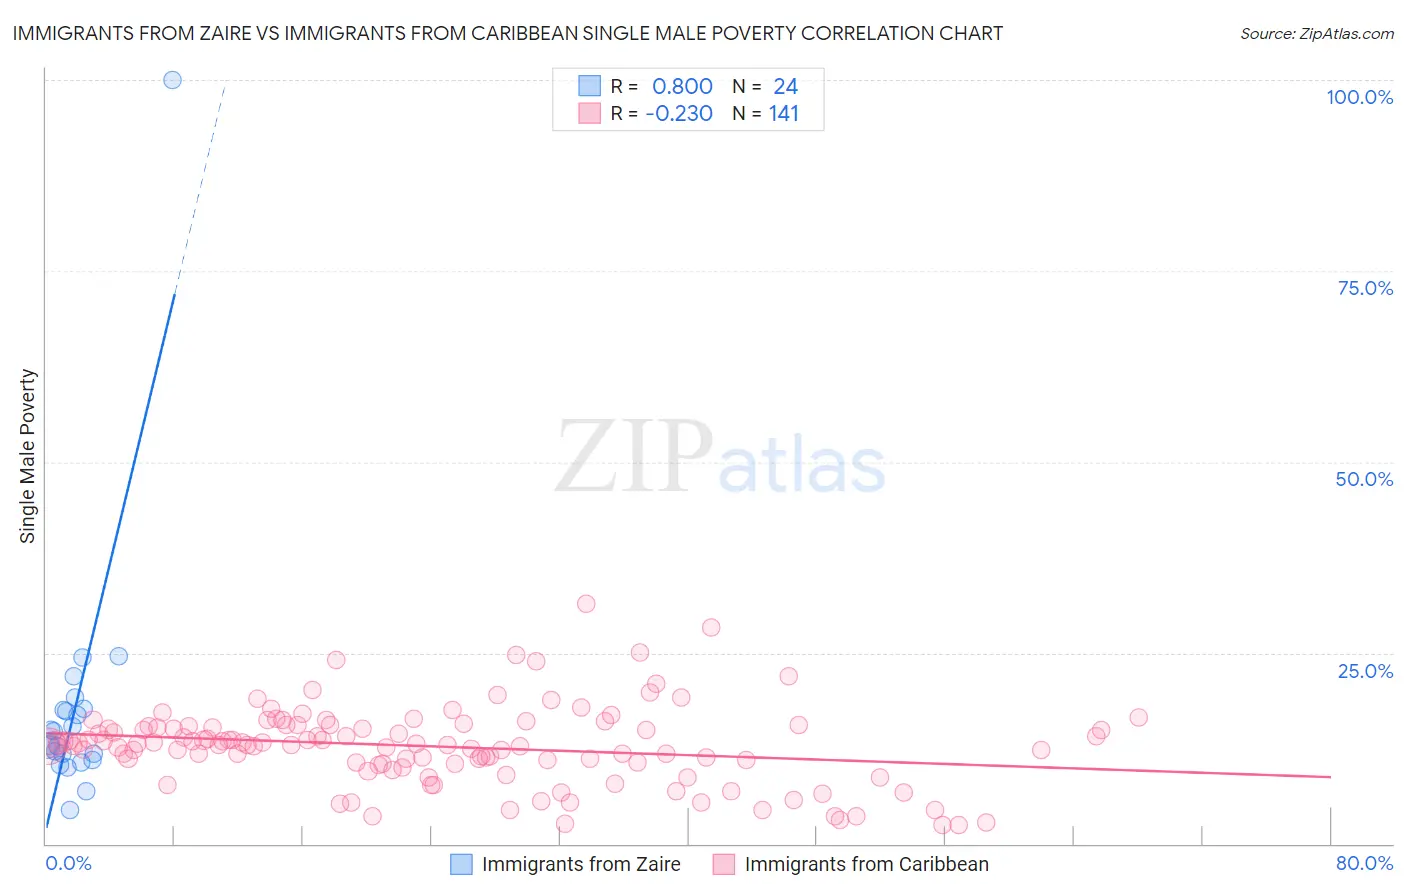
Immigrants from Zaire vs Immigrants from Caribbean Single Male Poverty Correlation Chart
The statistical analysis conducted on geographies consisting of 103,503,403 people shows a strong positive correlation between the proportion of Immigrants from Zaire and poverty level among single males in the United States with a correlation coefficient (R) of 0.800 and weighted average of 13.6%. Similarly, the statistical analysis conducted on geographies consisting of 393,892,998 people shows a weak negative correlation between the proportion of Immigrants from Caribbean and poverty level among single males in the United States with a correlation coefficient (R) of -0.230 and weighted average of 13.3%, a difference of 2.2%.
Single Male Poverty Correlation Summary
| Measurement | Immigrants from Zaire | Immigrants from Caribbean |
| Minimum | 4.4% | 2.4% |
| Maximum | 100.0% | 31.5% |
| Range | 95.6% | 29.0% |
| Mean | 18.0% | 12.8% |
| Median | 13.8% | 13.0% |
| Interquartile 25% (IQ1) | 11.3% | 10.5% |
| Interquartile 75% (IQ3) | 17.6% | 15.4% |
| Interquartile Range (IQR) | 6.2% | 4.9% |
| Standard Deviation (Sample) | 18.2% | 5.1% |
| Standard Deviation (Population) | 17.8% | 5.1% |
Demographics Similar to Immigrants from Zaire and Immigrants from Caribbean by Single Male Poverty
In terms of single male poverty, the demographic groups most similar to Immigrants from Zaire are Immigrants from Somalia (13.6%, a difference of 0.11%), Spanish (13.6%, a difference of 0.13%), Czech (13.5%, a difference of 0.37%), Belgian (13.5%, a difference of 0.39%), and Immigrants from Micronesia (13.5%, a difference of 0.41%). Similarly, the demographic groups most similar to Immigrants from Caribbean are Slavic (13.3%, a difference of 0.090%), British (13.3%, a difference of 0.29%), Canadian (13.3%, a difference of 0.29%), Bangladeshi (13.3%, a difference of 0.39%), and Luxembourger (13.4%, a difference of 0.44%).
| Demographics | Rating | Rank | Single Male Poverty |
| Slavs | 5.3 /100 | #231 | Tragic 13.3% |
| Immigrants | Caribbean | 5.0 /100 | #232 | Tragic 13.3% |
| British | 4.0 /100 | #233 | Tragic 13.3% |
| Canadians | 4.0 /100 | #234 | Tragic 13.3% |
| Bangladeshis | 3.7 /100 | #235 | Tragic 13.3% |
| Luxembourgers | 3.6 /100 | #236 | Tragic 13.4% |
| British West Indians | 3.4 /100 | #237 | Tragic 13.4% |
| Immigrants | Ghana | 3.2 /100 | #238 | Tragic 13.4% |
| Czechoslovakians | 3.0 /100 | #239 | Tragic 13.4% |
| Belizeans | 2.3 /100 | #240 | Tragic 13.4% |
| Immigrants | Germany | 2.1 /100 | #241 | Tragic 13.4% |
| Carpatho Rusyns | 2.1 /100 | #242 | Tragic 13.4% |
| Barbadians | 2.1 /100 | #243 | Tragic 13.4% |
| Immigrants | Senegal | 1.7 /100 | #244 | Tragic 13.5% |
| Immigrants | Latin America | 1.3 /100 | #245 | Tragic 13.5% |
| Immigrants | Micronesia | 1.2 /100 | #246 | Tragic 13.5% |
| Belgians | 1.2 /100 | #247 | Tragic 13.5% |
| Czechs | 1.2 /100 | #248 | Tragic 13.5% |
| Spanish | 1.0 /100 | #249 | Tragic 13.6% |
| Immigrants | Somalia | 1.0 /100 | #250 | Tragic 13.6% |
| Immigrants | Zaire | 0.9 /100 | #251 | Tragic 13.6% |