Nigerian vs Immigrants from Belarus Single Father Poverty
COMPARE
Nigerian
Immigrants from Belarus
Single Father Poverty
Single Father Poverty Comparison
Nigerians
Immigrants from Belarus
16.1%
SINGLE FATHER POVERTY
76.8/ 100
METRIC RATING
148th/ 347
METRIC RANK
15.8%
SINGLE FATHER POVERTY
92.4/ 100
METRIC RATING
119th/ 347
METRIC RANK
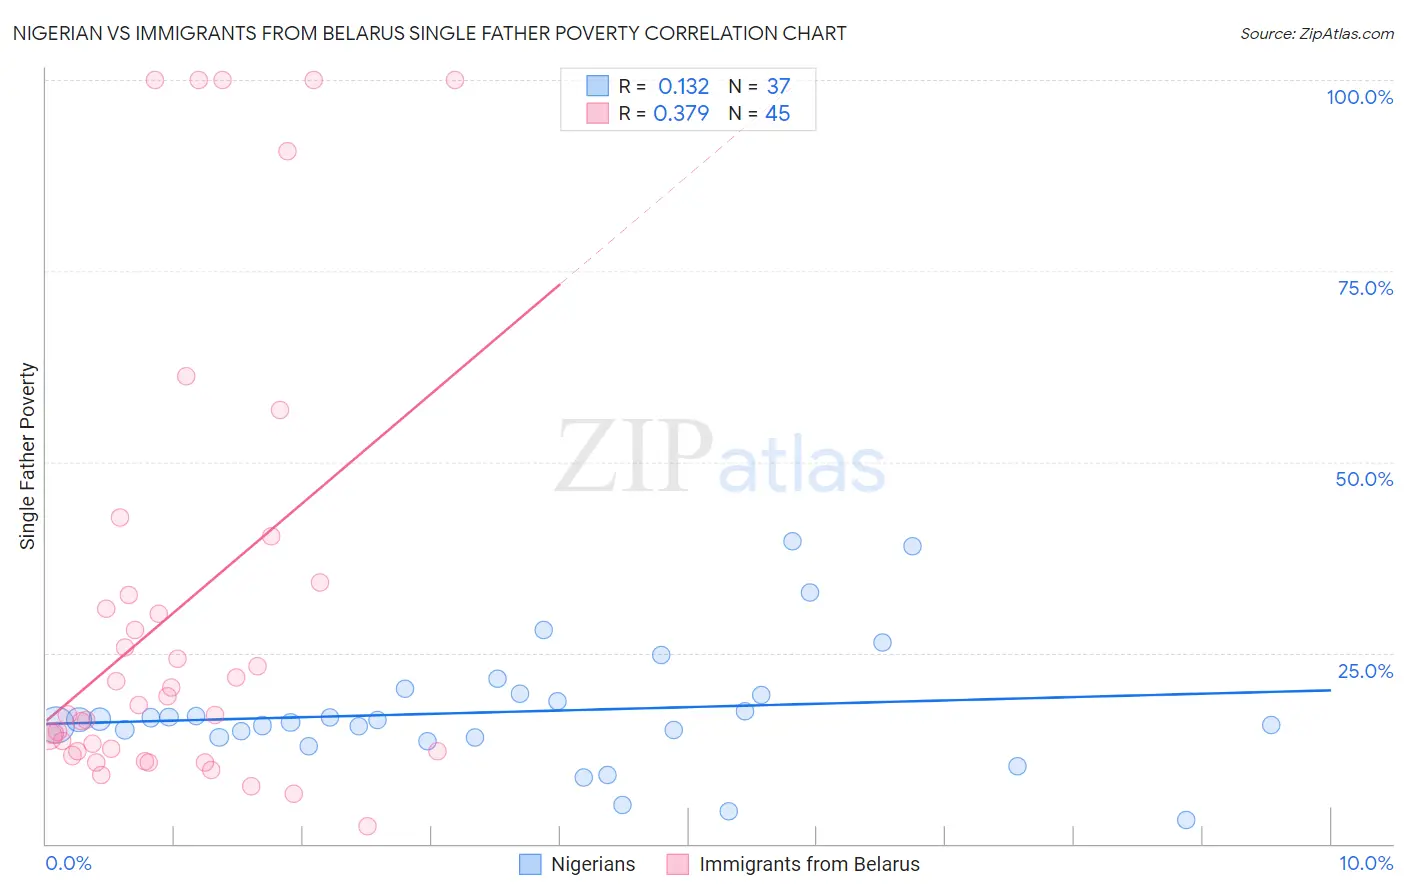
Nigerian vs Immigrants from Belarus Single Father Poverty Correlation Chart
The statistical analysis conducted on geographies consisting of 274,896,002 people shows a poor positive correlation between the proportion of Nigerians and poverty level among single fathers in the United States with a correlation coefficient (R) of 0.132 and weighted average of 16.1%. Similarly, the statistical analysis conducted on geographies consisting of 126,587,431 people shows a mild positive correlation between the proportion of Immigrants from Belarus and poverty level among single fathers in the United States with a correlation coefficient (R) of 0.379 and weighted average of 15.8%, a difference of 1.5%.
Single Father Poverty Correlation Summary
| Measurement | Nigerian | Immigrants from Belarus |
| Minimum | 3.1% | 2.4% |
| Maximum | 39.7% | 100.0% |
| Range | 36.6% | 97.6% |
| Mean | 17.3% | 30.7% |
| Median | 16.2% | 18.2% |
| Interquartile 25% (IQ1) | 13.9% | 12.1% |
| Interquartile 75% (IQ3) | 19.6% | 33.4% |
| Interquartile Range (IQR) | 5.7% | 21.3% |
| Standard Deviation (Sample) | 8.0% | 29.5% |
| Standard Deviation (Population) | 7.9% | 29.1% |
Similar Demographics by Single Father Poverty
Demographics Similar to Nigerians by Single Father Poverty
In terms of single father poverty, the demographic groups most similar to Nigerians are Colombian (16.1%, a difference of 0.020%), Immigrants from Hungary (16.1%, a difference of 0.10%), South African (16.1%, a difference of 0.10%), Jordanian (16.1%, a difference of 0.16%), and Immigrants from France (16.1%, a difference of 0.22%).
| Demographics | Rating | Rank | Single Father Poverty |
| Liberians | 83.3 /100 | #141 | Excellent 16.0% |
| Immigrants | Mexico | 83.3 /100 | #142 | Excellent 16.0% |
| Immigrants | Central America | 83.1 /100 | #143 | Excellent 16.0% |
| Immigrants | Kuwait | 81.4 /100 | #144 | Excellent 16.0% |
| Immigrants | Western Asia | 80.7 /100 | #145 | Excellent 16.0% |
| Immigrants | Hungary | 78.3 /100 | #146 | Good 16.1% |
| Colombians | 77.1 /100 | #147 | Good 16.1% |
| Nigerians | 76.8 /100 | #148 | Good 16.1% |
| South Africans | 75.1 /100 | #149 | Good 16.1% |
| Jordanians | 74.2 /100 | #150 | Good 16.1% |
| Immigrants | France | 73.1 /100 | #151 | Good 16.1% |
| Immigrants | Zimbabwe | 72.1 /100 | #152 | Good 16.1% |
| Immigrants | Israel | 72.0 /100 | #153 | Good 16.1% |
| Mexicans | 70.1 /100 | #154 | Good 16.1% |
| Immigrants | Nicaragua | 67.8 /100 | #155 | Good 16.2% |
Demographics Similar to Immigrants from Belarus by Single Father Poverty
In terms of single father poverty, the demographic groups most similar to Immigrants from Belarus are Immigrants from Eastern Europe (15.8%, a difference of 0.010%), Immigrants from Colombia (15.8%, a difference of 0.030%), Immigrants from Argentina (15.8%, a difference of 0.050%), Uruguayan (15.9%, a difference of 0.060%), and Immigrants (15.9%, a difference of 0.080%).
| Demographics | Rating | Rank | Single Father Poverty |
| Immigrants | Latvia | 94.7 /100 | #112 | Exceptional 15.8% |
| Danes | 94.5 /100 | #113 | Exceptional 15.8% |
| Argentineans | 94.4 /100 | #114 | Exceptional 15.8% |
| Immigrants | Thailand | 93.6 /100 | #115 | Exceptional 15.8% |
| Immigrants | Argentina | 92.8 /100 | #116 | Exceptional 15.8% |
| Immigrants | Colombia | 92.6 /100 | #117 | Exceptional 15.8% |
| Immigrants | Eastern Europe | 92.5 /100 | #118 | Exceptional 15.8% |
| Immigrants | Belarus | 92.4 /100 | #119 | Exceptional 15.8% |
| Uruguayans | 92.1 /100 | #120 | Exceptional 15.9% |
| Immigrants | Immigrants | 91.9 /100 | #121 | Exceptional 15.9% |
| Sudanese | 91.6 /100 | #122 | Exceptional 15.9% |
| Palestinians | 91.3 /100 | #123 | Exceptional 15.9% |
| Immigrants | Panama | 91.3 /100 | #124 | Exceptional 15.9% |
| Iraqis | 91.2 /100 | #125 | Exceptional 15.9% |
| Hmong | 91.1 /100 | #126 | Exceptional 15.9% |