Nigerian vs Immigrants from Micronesia Female Disability
COMPARE
Nigerian
Immigrants from Micronesia
Female Disability
Female Disability Comparison
Nigerians
Immigrants from Micronesia
12.0%
FEMALE DISABILITY
84.0/ 100
METRIC RATING
147th/ 347
METRIC RANK
13.5%
FEMALE DISABILITY
0.0/ 100
METRIC RATING
304th/ 347
METRIC RANK
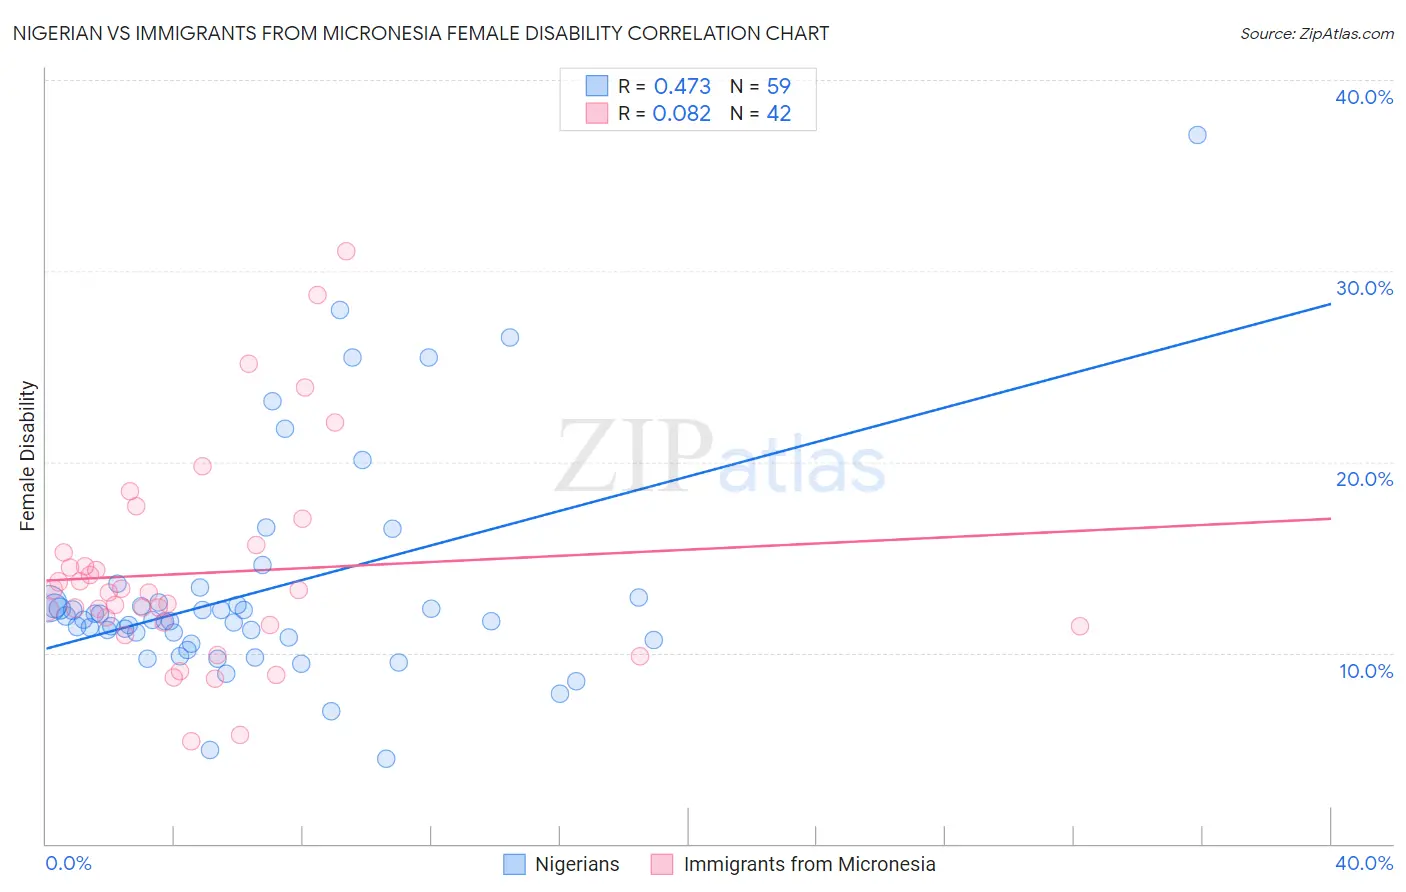
Nigerian vs Immigrants from Micronesia Female Disability Correlation Chart
The statistical analysis conducted on geographies consisting of 332,726,873 people shows a moderate positive correlation between the proportion of Nigerians and percentage of females with a disability in the United States with a correlation coefficient (R) of 0.473 and weighted average of 12.0%. Similarly, the statistical analysis conducted on geographies consisting of 61,603,210 people shows a slight positive correlation between the proportion of Immigrants from Micronesia and percentage of females with a disability in the United States with a correlation coefficient (R) of 0.082 and weighted average of 13.5%, a difference of 12.1%.
Female Disability Correlation Summary
| Measurement | Nigerian | Immigrants from Micronesia |
| Minimum | 4.4% | 5.4% |
| Maximum | 37.1% | 31.1% |
| Range | 32.7% | 25.7% |
| Mean | 13.2% | 14.2% |
| Median | 11.7% | 13.2% |
| Interquartile 25% (IQ1) | 10.6% | 11.4% |
| Interquartile 75% (IQ3) | 12.7% | 15.3% |
| Interquartile Range (IQR) | 2.0% | 3.8% |
| Standard Deviation (Sample) | 5.8% | 5.4% |
| Standard Deviation (Population) | 5.7% | 5.4% |
Similar Demographics by Female Disability
Demographics Similar to Nigerians by Female Disability
In terms of female disability, the demographic groups most similar to Nigerians are Pakistani (12.0%, a difference of 0.040%), Immigrants from Kenya (12.0%, a difference of 0.070%), Greek (12.0%, a difference of 0.14%), Immigrants from Moldova (12.0%, a difference of 0.18%), and Icelander (12.0%, a difference of 0.22%).
| Demographics | Rating | Rank | Female Disability |
| Romanians | 91.6 /100 | #140 | Exceptional 11.9% |
| Immigrants | Ecuador | 91.5 /100 | #141 | Exceptional 11.9% |
| Immigrants | Africa | 90.0 /100 | #142 | Excellent 11.9% |
| Immigrants | Sudan | 89.6 /100 | #143 | Excellent 11.9% |
| Immigrants | Austria | 87.9 /100 | #144 | Excellent 12.0% |
| Estonians | 87.8 /100 | #145 | Excellent 12.0% |
| Pakistanis | 84.6 /100 | #146 | Excellent 12.0% |
| Nigerians | 84.0 /100 | #147 | Excellent 12.0% |
| Immigrants | Kenya | 83.1 /100 | #148 | Excellent 12.0% |
| Greeks | 82.0 /100 | #149 | Excellent 12.0% |
| Immigrants | Moldova | 81.4 /100 | #150 | Excellent 12.0% |
| Icelanders | 80.7 /100 | #151 | Excellent 12.0% |
| Immigrants | Scotland | 79.3 /100 | #152 | Good 12.0% |
| Sudanese | 79.1 /100 | #153 | Good 12.0% |
| Syrians | 76.9 /100 | #154 | Good 12.1% |
Demographics Similar to Immigrants from Micronesia by Female Disability
In terms of female disability, the demographic groups most similar to Immigrants from Micronesia are Scotch-Irish (13.4%, a difference of 0.030%), Immigrants from Portugal (13.5%, a difference of 0.030%), African (13.4%, a difference of 0.17%), Dominican (13.5%, a difference of 0.31%), and Pennsylvania German (13.4%, a difference of 0.37%).
| Demographics | Rating | Rank | Female Disability |
| Slovaks | 0.0 /100 | #297 | Tragic 13.3% |
| Immigrants | Nonimmigrants | 0.0 /100 | #298 | Tragic 13.4% |
| Immigrants | Dominican Republic | 0.0 /100 | #299 | Tragic 13.4% |
| Pennsylvania Germans | 0.0 /100 | #300 | Tragic 13.4% |
| Africans | 0.0 /100 | #301 | Tragic 13.4% |
| Scotch-Irish | 0.0 /100 | #302 | Tragic 13.4% |
| Immigrants | Portugal | 0.0 /100 | #303 | Tragic 13.5% |
| Immigrants | Micronesia | 0.0 /100 | #304 | Tragic 13.5% |
| Dominicans | 0.0 /100 | #305 | Tragic 13.5% |
| French Canadians | 0.0 /100 | #306 | Tragic 13.6% |
| Central American Indians | 0.0 /100 | #307 | Tragic 13.6% |
| Cree | 0.0 /100 | #308 | Tragic 13.7% |
| French American Indians | 0.0 /100 | #309 | Tragic 13.7% |
| Apache | 0.0 /100 | #310 | Tragic 13.7% |
| Hopi | 0.0 /100 | #311 | Tragic 13.7% |