Nigerian vs Immigrants from Micronesia Unemployment Among Women with Children Under 18 years
COMPARE
Nigerian
Immigrants from Micronesia
Unemployment Among Women with Children Under 18 years
Unemployment Among Women with Children Under 18 years Comparison
Nigerians
Immigrants from Micronesia
6.1%
UNEMPLOYMENT AMONG WOMEN WITH CHILDREN UNDER 18 YEARS
0.1/ 100
METRIC RATING
260th/ 347
METRIC RANK
5.6%
UNEMPLOYMENT AMONG WOMEN WITH CHILDREN UNDER 18 YEARS
17.1/ 100
METRIC RATING
202nd/ 347
METRIC RANK
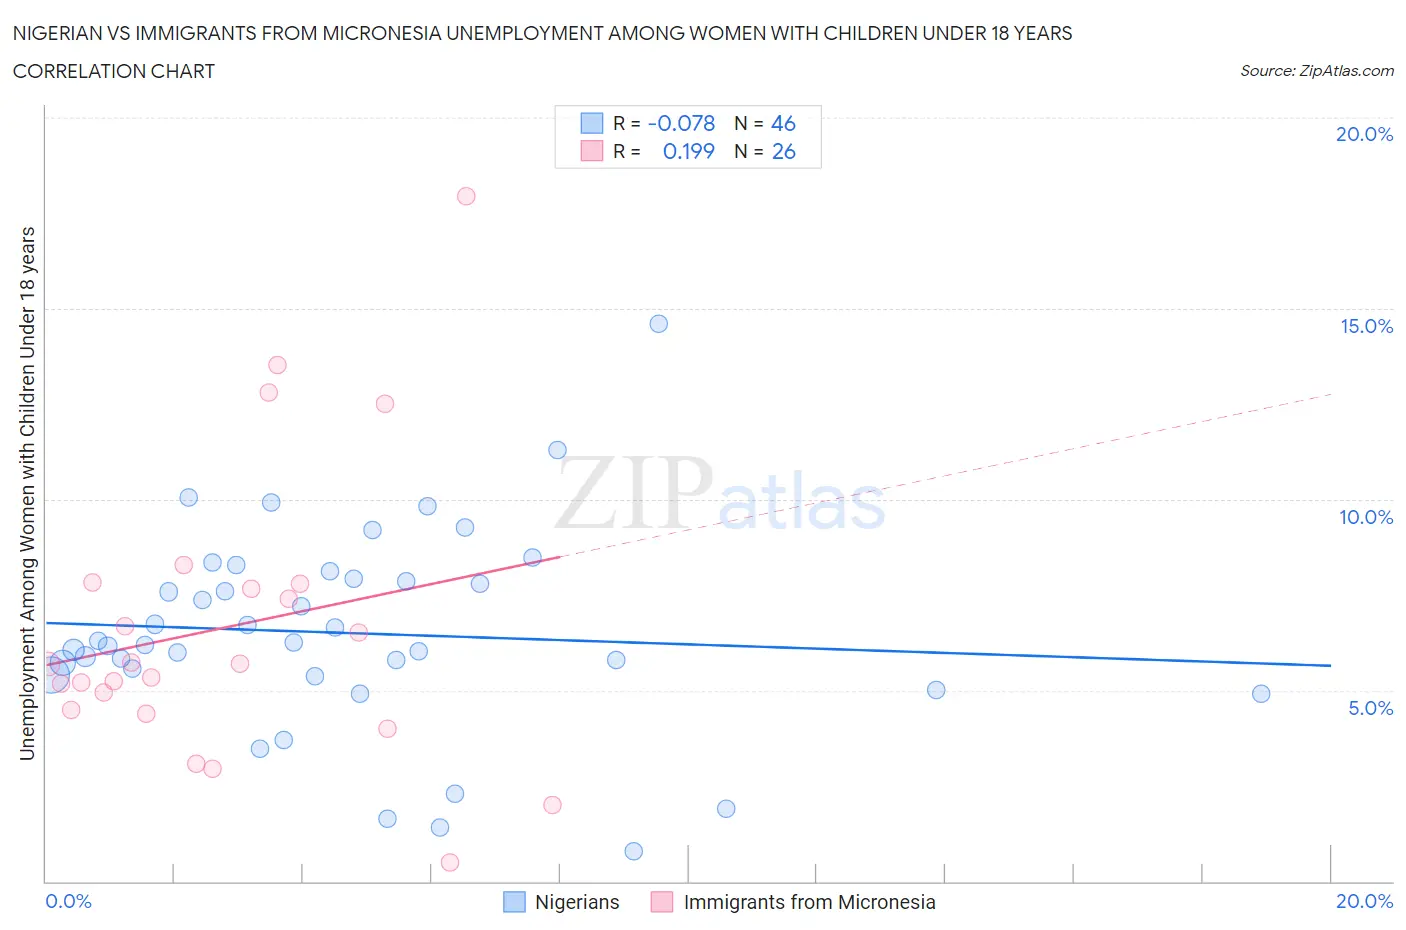
Nigerian vs Immigrants from Micronesia Unemployment Among Women with Children Under 18 years Correlation Chart
The statistical analysis conducted on geographies consisting of 324,596,280 people shows a slight negative correlation between the proportion of Nigerians and unemployment rate among women with children under the age of 18 in the United States with a correlation coefficient (R) of -0.078 and weighted average of 6.1%. Similarly, the statistical analysis conducted on geographies consisting of 60,946,294 people shows a poor positive correlation between the proportion of Immigrants from Micronesia and unemployment rate among women with children under the age of 18 in the United States with a correlation coefficient (R) of 0.199 and weighted average of 5.6%, a difference of 9.5%.
Unemployment Among Women with Children Under 18 years Correlation Summary
| Measurement | Nigerian | Immigrants from Micronesia |
| Minimum | 0.80% | 0.50% |
| Maximum | 14.6% | 17.9% |
| Range | 13.8% | 17.4% |
| Mean | 6.5% | 6.7% |
| Median | 6.2% | 5.7% |
| Interquartile 25% (IQ1) | 5.4% | 4.5% |
| Interquartile 75% (IQ3) | 7.9% | 7.8% |
| Interquartile Range (IQR) | 2.5% | 3.3% |
| Standard Deviation (Sample) | 2.6% | 3.8% |
| Standard Deviation (Population) | 2.6% | 3.8% |
Similar Demographics by Unemployment Among Women with Children Under 18 years
Demographics Similar to Nigerians by Unemployment Among Women with Children Under 18 years
In terms of unemployment among women with children under 18 years, the demographic groups most similar to Nigerians are Ottawa (6.1%, a difference of 0.020%), Immigrants from Liberia (6.1%, a difference of 0.10%), Immigrants from Trinidad and Tobago (6.1%, a difference of 0.10%), Spanish American Indian (6.1%, a difference of 0.12%), and Comanche (6.1%, a difference of 0.19%).
| Demographics | Rating | Rank | Unemployment Among Women with Children Under 18 years |
| Immigrants | Congo | 0.4 /100 | #253 | Tragic 6.0% |
| Immigrants | Azores | 0.3 /100 | #254 | Tragic 6.0% |
| Liberians | 0.2 /100 | #255 | Tragic 6.0% |
| Nepalese | 0.2 /100 | #256 | Tragic 6.0% |
| Bermudans | 0.1 /100 | #257 | Tragic 6.1% |
| Immigrants | Nigeria | 0.1 /100 | #258 | Tragic 6.1% |
| Ottawa | 0.1 /100 | #259 | Tragic 6.1% |
| Nigerians | 0.1 /100 | #260 | Tragic 6.1% |
| Immigrants | Liberia | 0.1 /100 | #261 | Tragic 6.1% |
| Immigrants | Trinidad and Tobago | 0.1 /100 | #262 | Tragic 6.1% |
| Spanish American Indians | 0.1 /100 | #263 | Tragic 6.1% |
| Comanche | 0.1 /100 | #264 | Tragic 6.1% |
| Immigrants | Bahamas | 0.1 /100 | #265 | Tragic 6.1% |
| Sub-Saharan Africans | 0.1 /100 | #266 | Tragic 6.2% |
| French American Indians | 0.1 /100 | #267 | Tragic 6.2% |
Demographics Similar to Immigrants from Micronesia by Unemployment Among Women with Children Under 18 years
In terms of unemployment among women with children under 18 years, the demographic groups most similar to Immigrants from Micronesia are Immigrants from Morocco (5.6%, a difference of 0.10%), Portuguese (5.6%, a difference of 0.15%), Menominee (5.6%, a difference of 0.18%), Israeli (5.6%, a difference of 0.18%), and Tsimshian (5.6%, a difference of 0.23%).
| Demographics | Rating | Rank | Unemployment Among Women with Children Under 18 years |
| Colombians | 22.8 /100 | #195 | Fair 5.6% |
| Spaniards | 22.8 /100 | #196 | Fair 5.6% |
| Immigrants | Colombia | 21.4 /100 | #197 | Fair 5.6% |
| Arabs | 21.4 /100 | #198 | Fair 5.6% |
| Marshallese | 20.2 /100 | #199 | Fair 5.6% |
| Menominee | 18.6 /100 | #200 | Poor 5.6% |
| Immigrants | Morocco | 17.9 /100 | #201 | Poor 5.6% |
| Immigrants | Micronesia | 17.1 /100 | #202 | Poor 5.6% |
| Portuguese | 15.9 /100 | #203 | Poor 5.6% |
| Israelis | 15.6 /100 | #204 | Poor 5.6% |
| Tsimshian | 15.2 /100 | #205 | Poor 5.6% |
| Nicaraguans | 12.3 /100 | #206 | Poor 5.6% |
| Peruvians | 12.1 /100 | #207 | Poor 5.6% |
| Immigrants | Costa Rica | 11.6 /100 | #208 | Poor 5.6% |
| Immigrants | Western Asia | 11.3 /100 | #209 | Poor 5.6% |