Nicaraguan vs Osage 2 or more Vehicles in Household
COMPARE
Nicaraguan
Osage
2 or more Vehicles in Household
2 or more Vehicles in Household Comparison
Nicaraguans
Osage
56.1%
2 OR MORE VEHICLES IN HOUSEHOLD
79.9/ 100
METRIC RATING
150th/ 347
METRIC RANK
58.8%
2 OR MORE VEHICLES IN HOUSEHOLD
99.8/ 100
METRIC RATING
61st/ 347
METRIC RANK
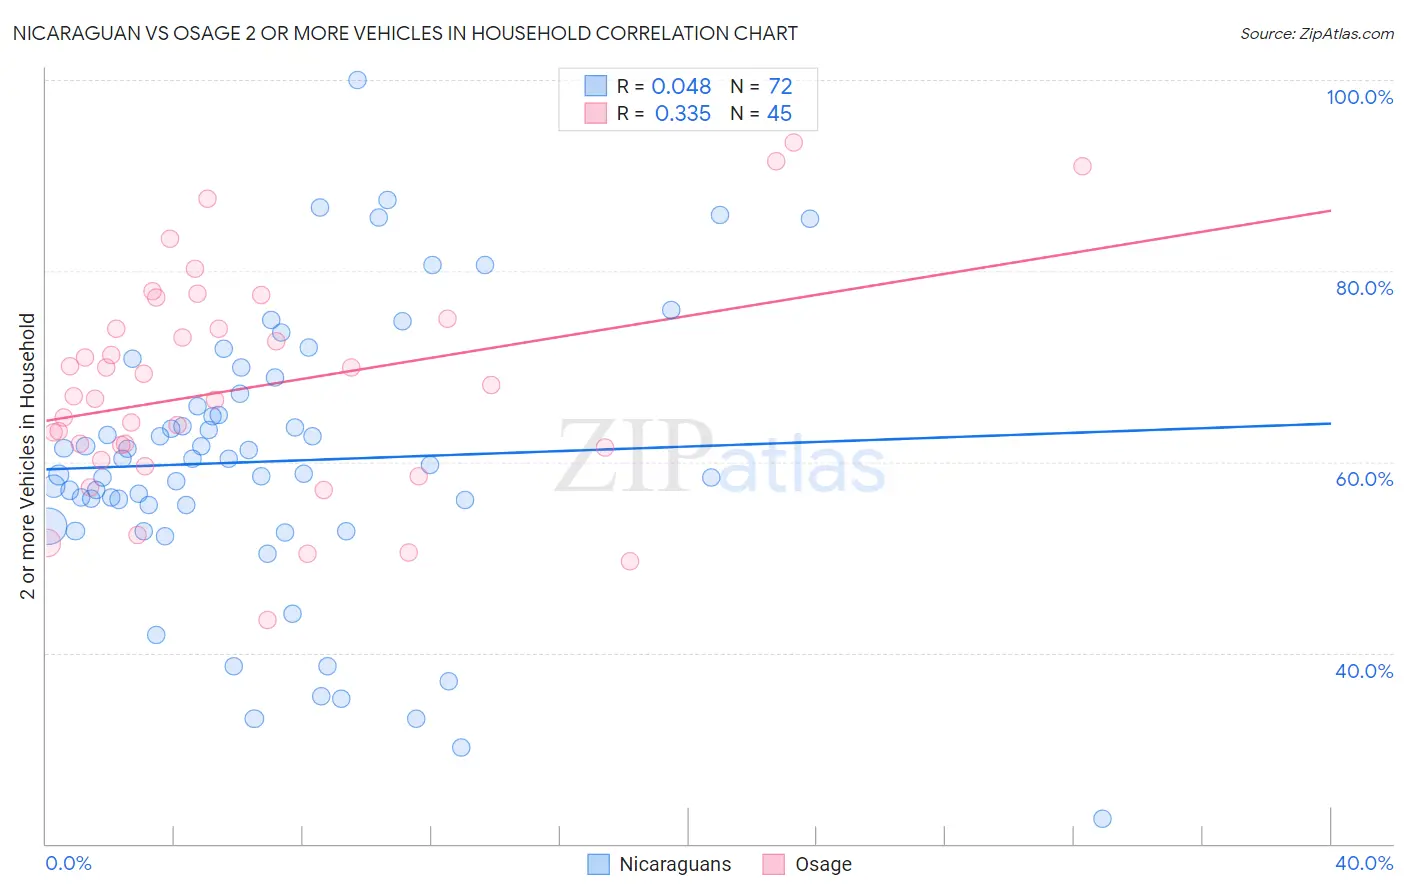
Nicaraguan vs Osage 2 or more Vehicles in Household Correlation Chart
The statistical analysis conducted on geographies consisting of 285,625,326 people shows no correlation between the proportion of Nicaraguans and percentage of households with 2 or more vehicles available in the United States with a correlation coefficient (R) of 0.048 and weighted average of 56.1%. Similarly, the statistical analysis conducted on geographies consisting of 91,799,602 people shows a mild positive correlation between the proportion of Osage and percentage of households with 2 or more vehicles available in the United States with a correlation coefficient (R) of 0.335 and weighted average of 58.8%, a difference of 4.8%.
2 or more Vehicles in Household Correlation Summary
| Measurement | Nicaraguan | Osage |
| Minimum | 22.6% | 43.5% |
| Maximum | 100.0% | 93.5% |
| Range | 77.4% | 50.0% |
| Mean | 60.1% | 67.8% |
| Median | 60.0% | 66.9% |
| Interquartile 25% (IQ1) | 54.4% | 60.8% |
| Interquartile 75% (IQ3) | 66.5% | 74.5% |
| Interquartile Range (IQR) | 12.1% | 13.7% |
| Standard Deviation (Sample) | 14.6% | 11.5% |
| Standard Deviation (Population) | 14.5% | 11.4% |
Similar Demographics by 2 or more Vehicles in Household
Demographics Similar to Nicaraguans by 2 or more Vehicles in Household
In terms of 2 or more vehicles in household, the demographic groups most similar to Nicaraguans are Immigrants from Moldova (56.1%, a difference of 0.020%), Chilean (56.1%, a difference of 0.020%), Serbian (56.1%, a difference of 0.030%), Venezuelan (56.1%, a difference of 0.050%), and Immigrants from Northern Europe (56.1%, a difference of 0.070%).
| Demographics | Rating | Rank | 2 or more Vehicles in Household |
| Seminole | 81.7 /100 | #143 | Excellent 56.2% |
| Immigrants | Syria | 81.4 /100 | #144 | Excellent 56.2% |
| Syrians | 81.2 /100 | #145 | Excellent 56.2% |
| Venezuelans | 80.7 /100 | #146 | Excellent 56.1% |
| Serbians | 80.3 /100 | #147 | Excellent 56.1% |
| Immigrants | Moldova | 80.2 /100 | #148 | Excellent 56.1% |
| Chileans | 80.2 /100 | #149 | Excellent 56.1% |
| Nicaraguans | 79.9 /100 | #150 | Good 56.1% |
| Immigrants | Northern Europe | 78.7 /100 | #151 | Good 56.1% |
| Immigrants | Pakistan | 78.1 /100 | #152 | Good 56.1% |
| Lumbee | 71.9 /100 | #153 | Good 55.9% |
| Ukrainians | 70.8 /100 | #154 | Good 55.8% |
| Immigrants | Venezuela | 70.7 /100 | #155 | Good 55.8% |
| Immigrants | Lithuania | 70.4 /100 | #156 | Good 55.8% |
| Immigrants | Kuwait | 70.2 /100 | #157 | Good 55.8% |
Demographics Similar to Osage by 2 or more Vehicles in Household
In terms of 2 or more vehicles in household, the demographic groups most similar to Osage are Nonimmigrants (58.8%, a difference of 0.040%), Mexican American Indian (58.7%, a difference of 0.11%), French Canadian (58.9%, a difference of 0.13%), Spanish American (58.9%, a difference of 0.16%), and Immigrants from Scotland (58.9%, a difference of 0.18%).
| Demographics | Rating | Rank | 2 or more Vehicles in Household |
| Bhutanese | 99.9 /100 | #54 | Exceptional 59.1% |
| Luxembourgers | 99.9 /100 | #55 | Exceptional 59.1% |
| Chickasaw | 99.9 /100 | #56 | Exceptional 59.0% |
| Afghans | 99.9 /100 | #57 | Exceptional 59.0% |
| Immigrants | Scotland | 99.8 /100 | #58 | Exceptional 58.9% |
| Spanish Americans | 99.8 /100 | #59 | Exceptional 58.9% |
| French Canadians | 99.8 /100 | #60 | Exceptional 58.9% |
| Osage | 99.8 /100 | #61 | Exceptional 58.8% |
| Immigrants | Nonimmigrants | 99.8 /100 | #62 | Exceptional 58.8% |
| Mexican American Indians | 99.8 /100 | #63 | Exceptional 58.7% |
| Portuguese | 99.7 /100 | #64 | Exceptional 58.6% |
| Immigrants | Central America | 99.7 /100 | #65 | Exceptional 58.6% |
| Croatians | 99.7 /100 | #66 | Exceptional 58.6% |
| Laotians | 99.7 /100 | #67 | Exceptional 58.6% |
| Canadians | 99.7 /100 | #68 | Exceptional 58.6% |