Nicaraguan vs Osage Receiving Food Stamps
COMPARE
Nicaraguan
Osage
Receiving Food Stamps
Receiving Food Stamps Comparison
Nicaraguans
Osage
16.1%
RECEIVING FOOD STAMPS
0.0/ 100
METRIC RATING
303rd/ 347
METRIC RANK
11.7%
RECEIVING FOOD STAMPS
49.8/ 100
METRIC RATING
175th/ 347
METRIC RANK
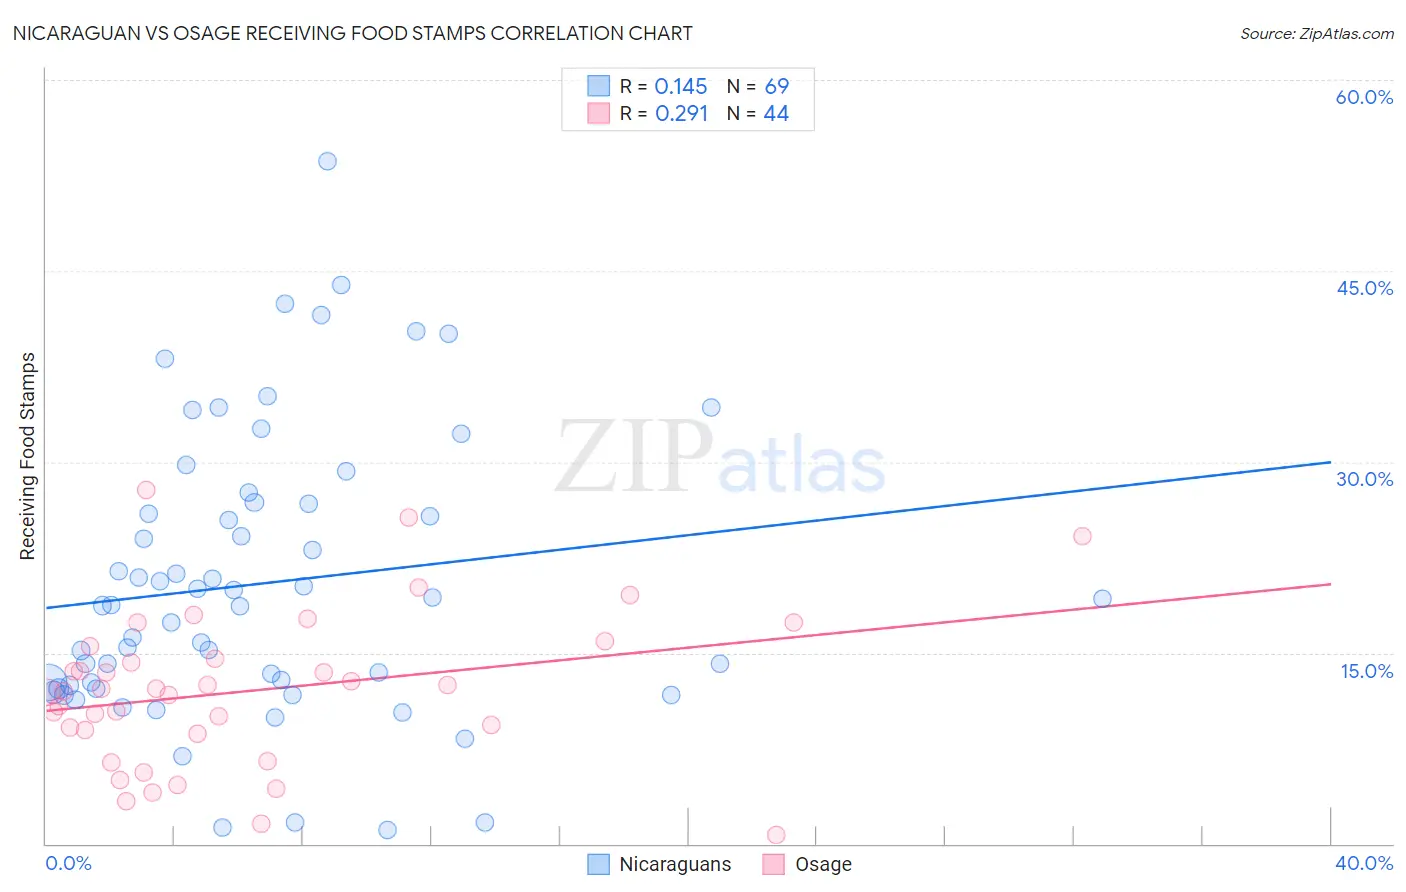
Nicaraguan vs Osage Receiving Food Stamps Correlation Chart
The statistical analysis conducted on geographies consisting of 285,345,977 people shows a poor positive correlation between the proportion of Nicaraguans and percentage of population receiving government assistance and/or food stamps in the United States with a correlation coefficient (R) of 0.145 and weighted average of 16.1%. Similarly, the statistical analysis conducted on geographies consisting of 91,766,497 people shows a weak positive correlation between the proportion of Osage and percentage of population receiving government assistance and/or food stamps in the United States with a correlation coefficient (R) of 0.291 and weighted average of 11.7%, a difference of 37.5%.
Receiving Food Stamps Correlation Summary
| Measurement | Nicaraguan | Osage |
| Minimum | 1.1% | 0.70% |
| Maximum | 53.6% | 27.8% |
| Range | 52.5% | 27.1% |
| Mean | 20.4% | 12.0% |
| Median | 18.7% | 12.1% |
| Interquartile 25% (IQ1) | 12.3% | 8.7% |
| Interquartile 75% (IQ3) | 26.7% | 15.0% |
| Interquartile Range (IQR) | 14.4% | 6.3% |
| Standard Deviation (Sample) | 11.2% | 6.1% |
| Standard Deviation (Population) | 11.1% | 6.0% |
Similar Demographics by Receiving Food Stamps
Demographics Similar to Nicaraguans by Receiving Food Stamps
In terms of receiving food stamps, the demographic groups most similar to Nicaraguans are Immigrants from West Indies (16.1%, a difference of 0.090%), West Indian (16.3%, a difference of 0.68%), Trinidadian and Tobagonian (16.0%, a difference of 1.0%), Immigrants from Bangladesh (15.9%, a difference of 1.5%), and Immigrants from the Azores (16.4%, a difference of 1.6%).
| Demographics | Rating | Rank | Receiving Food Stamps |
| Tsimshian | 0.0 /100 | #296 | Tragic 15.7% |
| Immigrants | Bahamas | 0.0 /100 | #297 | Tragic 15.8% |
| Immigrants | Trinidad and Tobago | 0.0 /100 | #298 | Tragic 15.8% |
| Hispanics or Latinos | 0.0 /100 | #299 | Tragic 15.8% |
| Immigrants | Bangladesh | 0.0 /100 | #300 | Tragic 15.9% |
| Trinidadians and Tobagonians | 0.0 /100 | #301 | Tragic 16.0% |
| Immigrants | West Indies | 0.0 /100 | #302 | Tragic 16.1% |
| Nicaraguans | 0.0 /100 | #303 | Tragic 16.1% |
| West Indians | 0.0 /100 | #304 | Tragic 16.3% |
| Immigrants | Azores | 0.0 /100 | #305 | Tragic 16.4% |
| Jamaicans | 0.0 /100 | #306 | Tragic 16.4% |
| Houma | 0.0 /100 | #307 | Tragic 16.5% |
| Barbadians | 0.0 /100 | #308 | Tragic 16.5% |
| U.S. Virgin Islanders | 0.0 /100 | #309 | Tragic 16.5% |
| Immigrants | Barbados | 0.0 /100 | #310 | Tragic 16.6% |
Demographics Similar to Osage by Receiving Food Stamps
In terms of receiving food stamps, the demographic groups most similar to Osage are Immigrants from Eritrea (11.7%, a difference of 0.020%), Peruvian (11.7%, a difference of 0.070%), Immigrants from Ukraine (11.8%, a difference of 0.21%), German Russian (11.8%, a difference of 0.24%), and Immigrants from Kenya (11.8%, a difference of 0.48%).
| Demographics | Rating | Rank | Receiving Food Stamps |
| Tlingit-Haida | 59.1 /100 | #168 | Average 11.6% |
| Immigrants | Eastern Africa | 58.3 /100 | #169 | Average 11.6% |
| Costa Ricans | 57.9 /100 | #170 | Average 11.6% |
| Immigrants | Western Asia | 56.4 /100 | #171 | Average 11.6% |
| Guamanians/Chamorros | 54.2 /100 | #172 | Average 11.7% |
| Immigrants | Syria | 53.4 /100 | #173 | Average 11.7% |
| Immigrants | Eritrea | 50.0 /100 | #174 | Average 11.7% |
| Osage | 49.8 /100 | #175 | Average 11.7% |
| Peruvians | 49.3 /100 | #176 | Average 11.7% |
| Immigrants | Ukraine | 48.4 /100 | #177 | Average 11.8% |
| German Russians | 48.1 /100 | #178 | Average 11.8% |
| Immigrants | Kenya | 46.4 /100 | #179 | Average 11.8% |
| Uruguayans | 44.8 /100 | #180 | Average 11.8% |
| South American Indians | 41.7 /100 | #181 | Average 11.9% |
| Immigrants | Morocco | 40.7 /100 | #182 | Average 11.9% |