New Zealander vs Immigrants from Morocco Child Poverty Among Girls Under 16
COMPARE
New Zealander
Immigrants from Morocco
Child Poverty Among Girls Under 16
Child Poverty Among Girls Under 16 Comparison
New Zealanders
Immigrants from Morocco
15.6%
CHILD POVERTY AMONG GIRLS UNDER 16
87.2/ 100
METRIC RATING
140th/ 347
METRIC RANK
16.8%
CHILD POVERTY AMONG GIRLS UNDER 16
34.6/ 100
METRIC RATING
187th/ 347
METRIC RANK
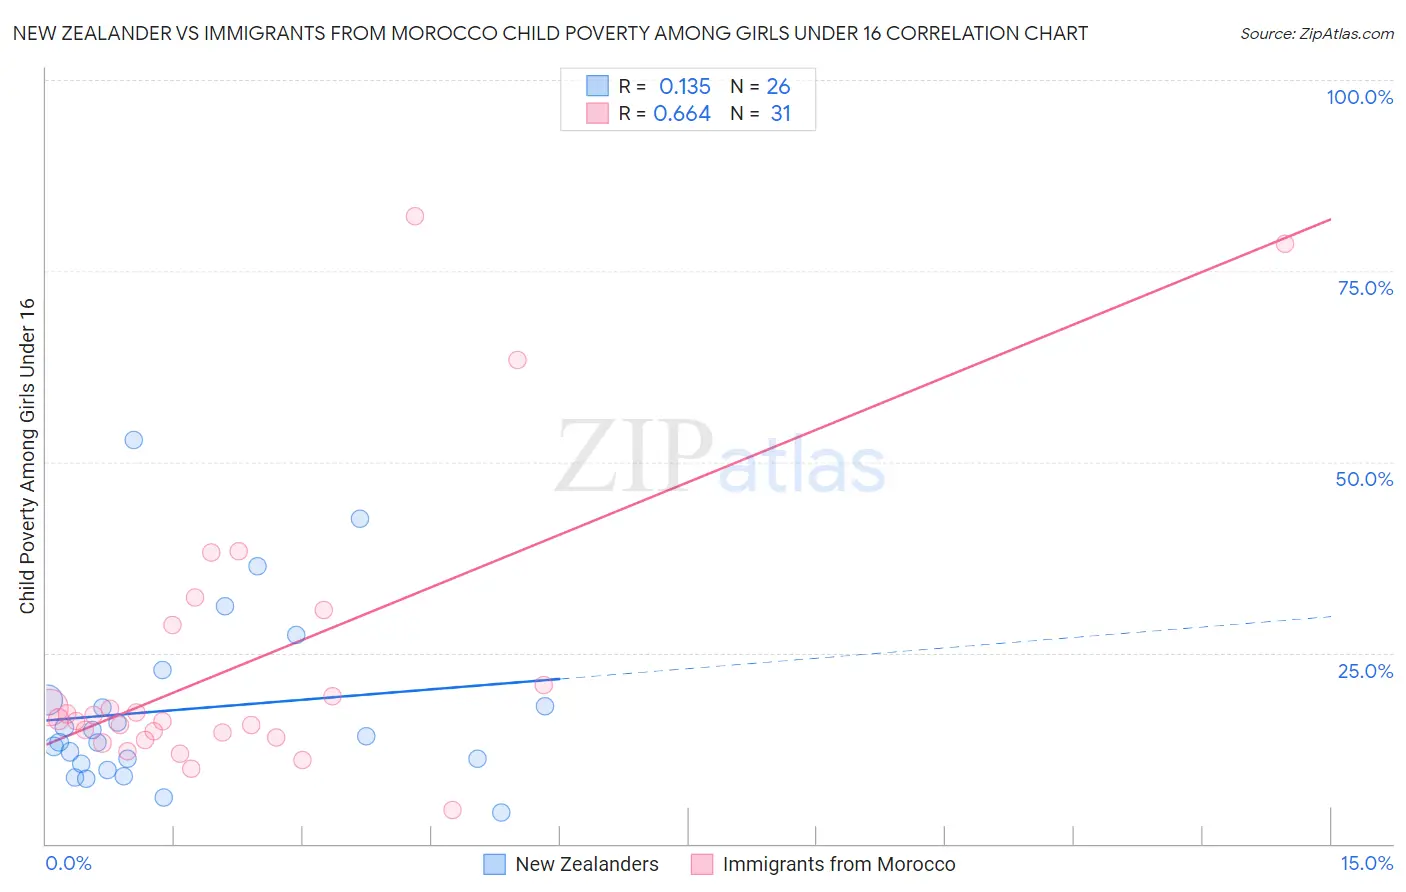
New Zealander vs Immigrants from Morocco Child Poverty Among Girls Under 16 Correlation Chart
The statistical analysis conducted on geographies consisting of 106,265,230 people shows a poor positive correlation between the proportion of New Zealanders and poverty level among girls under the age of 16 in the United States with a correlation coefficient (R) of 0.135 and weighted average of 15.6%. Similarly, the statistical analysis conducted on geographies consisting of 177,633,754 people shows a significant positive correlation between the proportion of Immigrants from Morocco and poverty level among girls under the age of 16 in the United States with a correlation coefficient (R) of 0.664 and weighted average of 16.8%, a difference of 7.8%.
Child Poverty Among Girls Under 16 Correlation Summary
| Measurement | New Zealander | Immigrants from Morocco |
| Minimum | 4.2% | 4.5% |
| Maximum | 52.9% | 82.2% |
| Range | 48.7% | 77.7% |
| Mean | 17.6% | 23.6% |
| Median | 13.7% | 16.3% |
| Interquartile 25% (IQ1) | 10.4% | 14.0% |
| Interquartile 75% (IQ3) | 18.8% | 28.7% |
| Interquartile Range (IQR) | 8.4% | 14.7% |
| Standard Deviation (Sample) | 11.6% | 18.9% |
| Standard Deviation (Population) | 11.4% | 18.5% |
Similar Demographics by Child Poverty Among Girls Under 16
Demographics Similar to New Zealanders by Child Poverty Among Girls Under 16
In terms of child poverty among girls under 16, the demographic groups most similar to New Zealanders are Immigrants from Jordan (15.6%, a difference of 0.010%), Canadian (15.6%, a difference of 0.030%), Armenian (15.5%, a difference of 0.18%), Immigrants from Peru (15.6%, a difference of 0.18%), and Israeli (15.6%, a difference of 0.26%).
| Demographics | Rating | Rank | Child Poverty Among Girls Under 16 |
| Brazilians | 89.6 /100 | #133 | Excellent 15.4% |
| Immigrants | Spain | 89.1 /100 | #134 | Excellent 15.5% |
| Czechoslovakians | 89.0 /100 | #135 | Excellent 15.5% |
| Native Hawaiians | 89.0 /100 | #136 | Excellent 15.5% |
| South Africans | 88.7 /100 | #137 | Excellent 15.5% |
| Immigrants | Vietnam | 88.2 /100 | #138 | Excellent 15.5% |
| Armenians | 87.9 /100 | #139 | Excellent 15.5% |
| New Zealanders | 87.2 /100 | #140 | Excellent 15.6% |
| Immigrants | Jordan | 87.2 /100 | #141 | Excellent 15.6% |
| Canadians | 87.1 /100 | #142 | Excellent 15.6% |
| Immigrants | Peru | 86.6 /100 | #143 | Excellent 15.6% |
| Israelis | 86.3 /100 | #144 | Excellent 15.6% |
| Welsh | 85.4 /100 | #145 | Excellent 15.6% |
| Samoans | 84.2 /100 | #146 | Excellent 15.7% |
| Slavs | 83.1 /100 | #147 | Excellent 15.7% |
Demographics Similar to Immigrants from Morocco by Child Poverty Among Girls Under 16
In terms of child poverty among girls under 16, the demographic groups most similar to Immigrants from Morocco are Arab (16.8%, a difference of 0.010%), South American Indian (16.8%, a difference of 0.050%), Immigrants from Uruguay (16.7%, a difference of 0.13%), Immigrants from Bosnia and Herzegovina (16.8%, a difference of 0.26%), and Kenyan (16.8%, a difference of 0.29%).
| Demographics | Rating | Rank | Child Poverty Among Girls Under 16 |
| Immigrants | Syria | 43.3 /100 | #180 | Average 16.6% |
| Immigrants | Iraq | 43.2 /100 | #181 | Average 16.6% |
| Immigrants | Ethiopia | 43.1 /100 | #182 | Average 16.6% |
| Immigrants | Portugal | 42.5 /100 | #183 | Average 16.6% |
| Scotch-Irish | 39.6 /100 | #184 | Fair 16.7% |
| Immigrants | Uruguay | 35.6 /100 | #185 | Fair 16.7% |
| South American Indians | 35.0 /100 | #186 | Fair 16.8% |
| Immigrants | Morocco | 34.6 /100 | #187 | Fair 16.8% |
| Arabs | 34.5 /100 | #188 | Fair 16.8% |
| Immigrants | Bosnia and Herzegovina | 32.5 /100 | #189 | Fair 16.8% |
| Kenyans | 32.3 /100 | #190 | Fair 16.8% |
| Immigrants | Azores | 31.3 /100 | #191 | Fair 16.8% |
| Immigrants | Uganda | 31.3 /100 | #192 | Fair 16.8% |
| Aleuts | 28.7 /100 | #193 | Fair 16.9% |
| Spanish | 28.6 /100 | #194 | Fair 16.9% |